matlab点云的可视化-源码复制粘贴即可(一)
一、导入并可视化一个无属性的点云
clc; clear; close; % clear everything

% Import a point cloud from a plain text file (run type('Lion.xyz') to see the contents of the file)
pc = pointCloud('Lion.xyz');

% Generate a z-colored view of the point cloud
pc.plot;

% Set three-dimensional view and add title
view(3); title('Z-colored plot of point cloud', 'Color', 'w');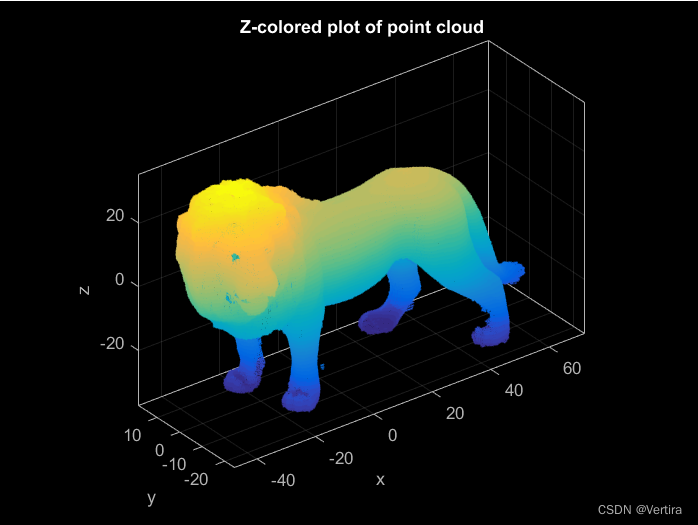
二、导入并加载一个有属性的点云
clc; clear; close; % clear everything

% Import point cloud with attributes (nx, ny, nz are the components of the normal vectors)
pc = pointCloud('Lion.xyz', 'Attributes', {'nx' 'ny' 'nz' 'roughness'});

% Plot point cloud colored according to imported attribute 'roughness'
pc.plot('Color', 'A.roughness', ... % attribute to plot
        'MarkerSize', 5); % size of points

% Set three-dimensional view and add title
view(3); title('Point cloud colored by roughness point attribute', 'Color', 'w');
三、从矩阵中导入点云
clc; clear; close; % clear everything

% Generate points on a unit sphere
[x, y, z] = sphere(100);
x = x(:); y = y(:); z = z(:);

% Import points and define a label for the point cloud
pc = pointCloud([x y z], 'Label', 'sphere');

% Plot point cloud
pc.plot('MarkerSize', 5);

% Set three-dimensional view and add title
view(3); title('Sphere', 'Color', 'w');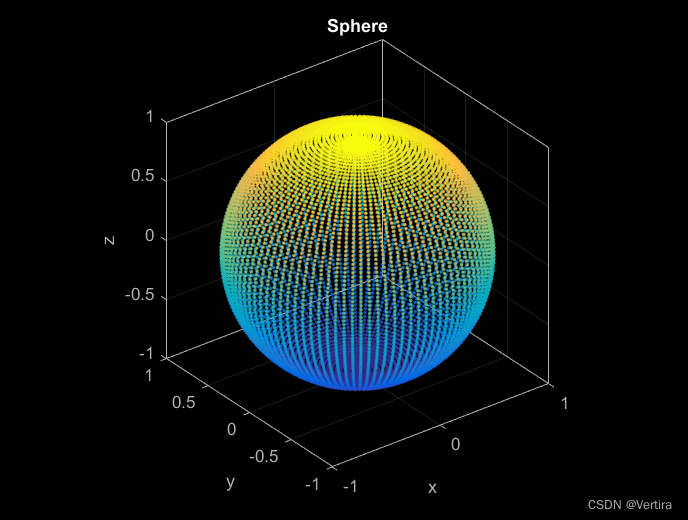
四、点云的rgb色图
clc; clear; close; % clear everything

% Import point cloud with attributes red, green and blue
pc = pointCloud('Dino.xyz', 'Attributes', {'r' 'g' 'b'});

% Plot point cloud
pc.plot('Color', 'A.rgb', ... % rgb-colored plot
        'MarkerSize', 5); % size of points

% Set three-dimensional view and add title
view(110,0); title('RGB-colored point cloud', 'Color', 'w');
五、导入两个点云,并以不同的颜色可视化它们
clc; clear; close; % clear everything

% Import point clouds
scan1 = pointCloud('LionScan1.xyz');
scan2 = pointCloud('LionScan2.xyz');

% Plot
scan1.plot('Color', 'y'); % yellow
scan2.plot('Color', 'm'); % magenta

% Set three-dimensional view and add title
view(3); title('Scan1 (=yellow) and scan2 (=magenta)', 'Color', 'w');
六、选择点的子集(即过滤/稀释点云)并将它们导出到文本文件
clc; clear; close; % clear everything

% Import point cloud
pc = pointCloud('Lion.xyz', 'Attributes', {'nx' 'ny' 'nz' 'roughness'});

% Select a random subset of points
pc.select('RandomSampling', 5); % select randomly 5 percent of points

% Export selected points to a plain text file with attributes
pc.export('LionSubset.xyz', 'Attributes', {'nx' 'ny' 'nz' 'roughness'});

% Plot
pc.plot('MarkerSize', 5);

% Set title
title('Z-colored plot of a subset of points', 'Color', 'w');
注意:属性pc。Act是一个n × 1的逻辑向量,定义每个点是活动(true)还是不活动(false)。
大多数方法只适用于活动点。
七、计算点云的法线并可视化它们
clc; clear; close; % clear everything

% Import point cloud
pc = pointCloud('Lion.xyz');

% Select a random subset of points
pc.select('RandomSampling', 1); % select randomly 1 percent of points

% Calculate normals (normals are only calculated for the selected points)
pc.normals(2); % search radius is 2

% Plot point cloud and normals
pc.plot('MarkerSize', 5);
pc.plotNormals('Scale', 10, 'Color', 'y'); % lenght of normals is 10

% Set three-dimensional view and add title
view(3); title('Normal vectors', 'Color', 'w');
八、变换点云 Transform a point cloud
clc; clear; close; % clear everything

% Import point cloud
pc = pointCloud('Lion.xyz');

% Plot original point cloud
pc.plot('Color', 'y');

% Transformation with a rotation angle of 100 gradians about the z axis
pc.transform(1, opk2R(0, 0, 100), zeros(3,1)); % opk2R generates a rotation matrix from 3 rotation angles (about the x, y and z axis / units = gradian!)

% Plot transformed point cloud
pc.plot('Color', 'm'); title('Point cloud transformation', 'Color', 'w');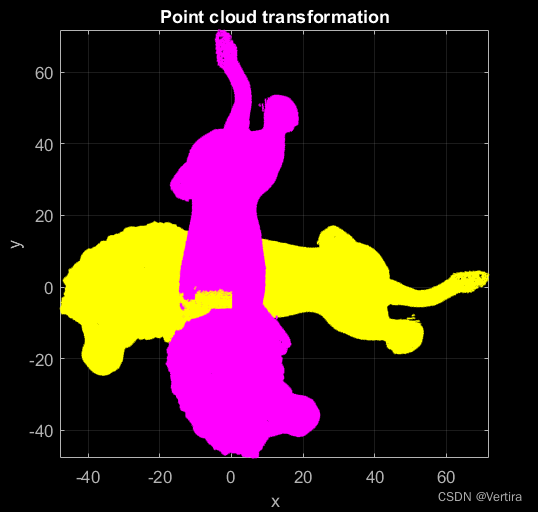
九、保存和加载点云
clc; clear; close; % clear everything

% Import point cloud
pc = pointCloud('Lion.xyz');

% Save to mat file
pc.save('Lion.mat');

% Clear point cloud
clear pc;

% Load point cloud from mat file
pcLoaded = pointCloud('Lion.mat');

% Plot
pcLoaded.plot;

% Set three-dimensional view and add title
view(3); title('Point cloud loaded from mat file', 'Color', 'w');
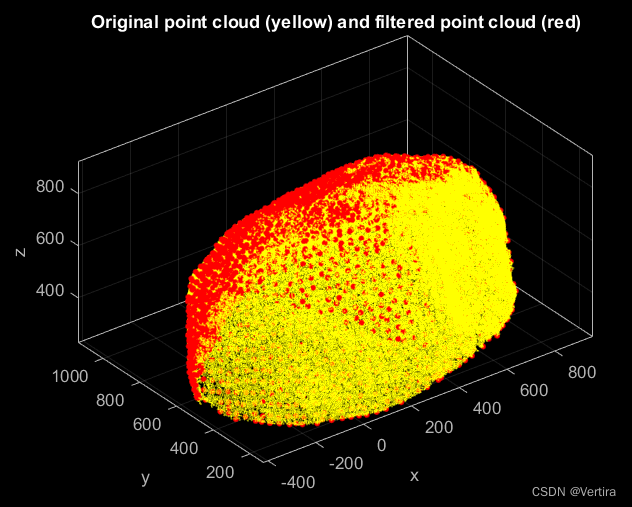
十、创建一个对象的副本,并选择其中的点子集
clc; clear; close; % clear everything

% Import point cloud
pc = pointCloud('Stone.ply'); % attributes from ply file are imported automatically

% Create an indipendent copy of the object
pcCopy = pc.copy;

% Select a subset of points and remove all non active points
pcCopy.select('UniformSampling', 40); % uniform sampling with mean sampling distance of 40 mm
pcCopy.reconstruct;

% Plot both point clouds
pc.plot('Color', 'y', 'MarkerSize', 1);
pcCopy.plot('Color', 'r', 'MarkerSize', 10);
view(3); title('Original point cloud (yellow) and filtered point cloud (red)', 'Color', 'w');