leaflet对线设置渐变色
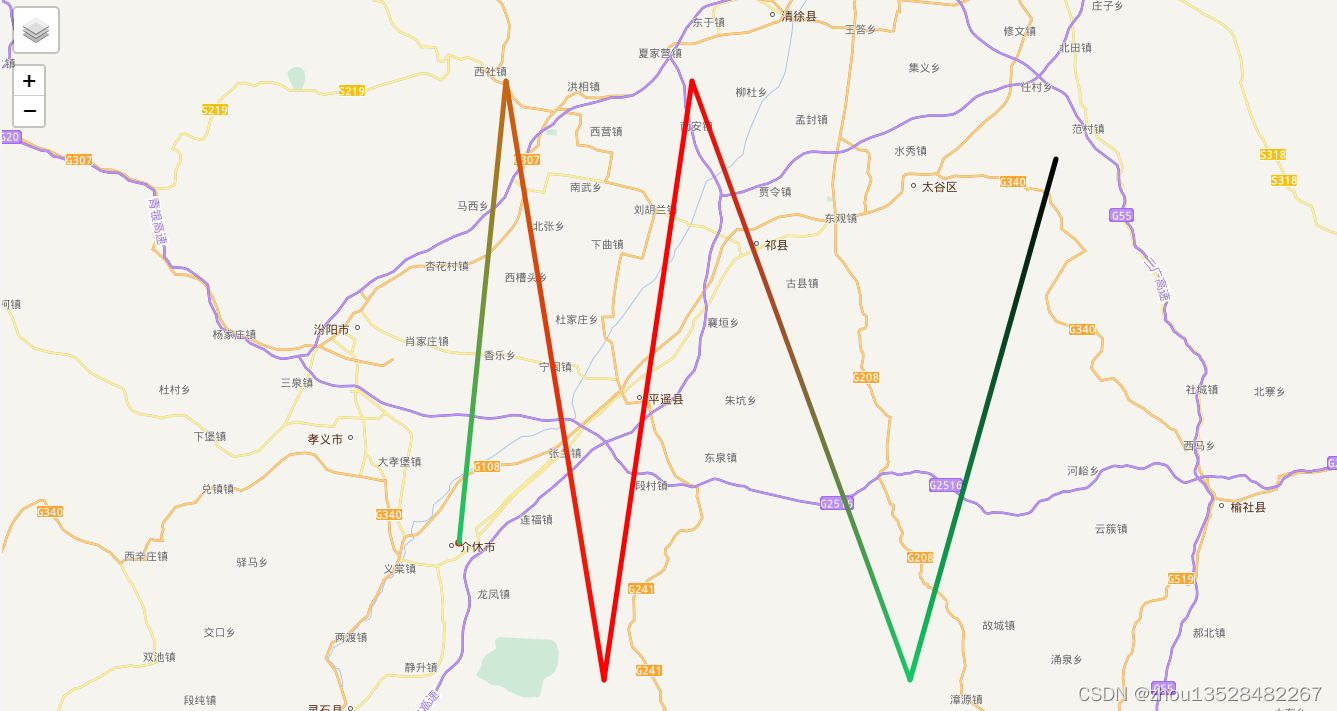
效果展示:
引用leaflet-polycolor组件
npm install leaflet-polycolor
.vue文件中使用
import leafletPolycolor from 'leaflet-polycolor';
leafletPolycolor(L);
const latLngs = [[37.03, 111.92], [37.53444, 111.98555], [36.88, 112.12], [37.53444, 112.24], [36.88, 112.54], [37.45, 112.74]];
const colors = ['rgb(20, 200, 100)', 'rgb(200, 100, 20)', null, null, 'rgb(20, 200, 100)', 'rgb(0, 0, 0)'];
L.polycolor(latLngs, {
color: "#ff0000",
colors: colors,
weight: 5
}).addTo(map);
完整代码:
<template>
  <div class="h-full">
    <div class="h-full w-full" id="map"></div>
  </div>
</template>

<script setup lang="ts">
import {ref, onMounted} from "vue";
import L from "leaflet";
import "leaflet.chinatmsproviders";

import leafletPolycolor from 'leaflet-polycolor';
leafletPolycolor(L);

function init() {
  const TDT_KEY = "天地图上面获取key";
  const normalm = L.tileLayer.chinaProvider("TianDiTu.Normal.Map", {
    key: TDT_KEY,
    maxZoom: 18,
    minZoom: 5,
  });
  const normala = L.tileLayer.chinaProvider("TianDiTu.Normal.Annotion", {
    key: TDT_KEY,
    maxZoom: 18,
    minZoom: 5,
  });
  const imgm = L.tileLayer.chinaProvider("TianDiTu.Satellite.Map", {
    key: TDT_KEY,
    maxZoom: 24,
    maxNativeZoom: 18,
    minZoom: 5,
  });
  const imga = L.tileLayer.chinaProvider("TianDiTu.Satellite.Annotion", {
    key: TDT_KEY,
    maxZoom: 24,
    maxNativeZoom: 18,
  });
  const normal = L.layerGroup([normalm, normala]);
  const image = L.layerGroup([imgm, imga]);
  const baseLayers = {
    地图: normal,
    影像: image,
  };
  // 初始化 map
  var map = new L.Map('map', {
    maxZoom: 24,
    minZoom: 5,
    center: [37.03, 111.92],
    zoom: 16,
    zoomControl: false,
    renderer: L.canvas({ tolerance: 16 }),
    layers: [normal],
  });
  L.control.layers(baseLayers, {}).addTo(map).setPosition("topleft");
  L.control.zoom().addTo(map).setPosition("topleft");
  L.circle([37.03, 111.92], { radius: 100, color: "#ff0000", weight: 5, fill: true, fillColor: "#00ff00", fillOpacity: 1 }).addTo(map);

  const latLngs = [[37.03, 111.92], [37.53444, 111.98555], [36.88, 112.12], [37.53444, 112.24], [36.88, 112.54], [37.45, 112.74]];
  const colors = ['rgb(20, 200, 100)', 'rgb(200, 100, 20)', null, null, 'rgb(20, 200, 100)', 'rgb(0, 0, 0)'];

  L.polycolor(latLngs, {
    color: "#ff0000",
    colors: colors,
    weight: 5
  }).addTo(map);
}

onMounted(() => {
  init();
})
</script>

<style lang="scss" scoped>

</style>
注意:如果线两端点没有渲染,则线显示颜色为配置color颜色,不为渐变色。