『亚马逊云科技产品测评』活动征文|基于亚马逊EC2云服务器安装Prometheus数据可视化监控
授权声明:本篇文章授权活动官方亚马逊云科技文章转发、改写权,包括不限于在 Developer Centre, 知乎,自媒体平台,第三方开发者媒体等亚马逊云科技官方渠道
亚马逊EC2云服务器(Elastic Compute Cloud)是亚马逊AWS(Amazon Web Services)提供的一种云计算服务。EC2代表弹性计算云,它允许用户租用虚拟计算资源,包括CPU、内存、存储和网络带宽,以满足计算需求。
由于亚马逊云科技服务种类较多,且计费详细,很多用户有些看不懂,所以对使用亚马逊云科技云服务器望而却步。其实亚马逊云科技很多服务都有免费套餐,以让用户体验,这些服务的免费套餐,搭建一个web服务绰绰有余。
数字化转型背景下,随着轻量化的容器化技术和微服务应用的深度融合,业务复杂度随之上升。基于Prometheus的容器云监控体系成为目前主流容器监控事实标准,本文主要介绍Prometheus云原生监控体系,涵盖指标采集、数据存储、可视化展示,告警入库等功能,结合生产实践供大家参考。
1. 亚马逊EC2优势
亚马逊EC2云服务器的主要特点和优势包括:
- 灵活性:用户可以根据需要随时启动、停止、调整和删除EC2实例,以便满足不断变化的计算需求。
- 可靠性:亚马逊EC2服务器提供高可用性和容错性,确保用户的应用程序能始终保持运行状态。此外,亚马逊EC2的服务等级协议承诺为每个EC2地区提供99.99%的可用性。
- 安全性:亚马逊EC2服务器提供了多层安全措施,包括网络隔离、数据加密和身份验证,以保护用户的数据和应用程序免受攻击。
- 成本效益:亚马逊EC2服务器采用按需计费模式,用户只需支付实际使用的计算资源费用,无需预先投资硬件或承担维护和管理物理服务器的费用。
- 可扩展性和功能性:亚马逊EC2提供了根据需要扩大或缩小规模的设施,能轻松处理各种动态场景。它还为用户提供了一个真正的虚拟计算平台,可以在其中执行各种操作,甚至可以从这个虚拟环境中启动另一个亚马逊EC2实例。
关于如何购买亚马逊云服务器,我这里不再重复赘述,详细可以查看这篇文章:https://blog.csdn.net/qq_43475285/article/details/134256935
2. 登录云服务器
2.1 EC2云服务器准备
在购买好云服务器后,进入控制台https://us-east-1.console.aws.amazon.com/console
tips: 在右上角区域选择,要和购买服务器时所选区域一致,否则无法找到已经购买的EC2服务器资源

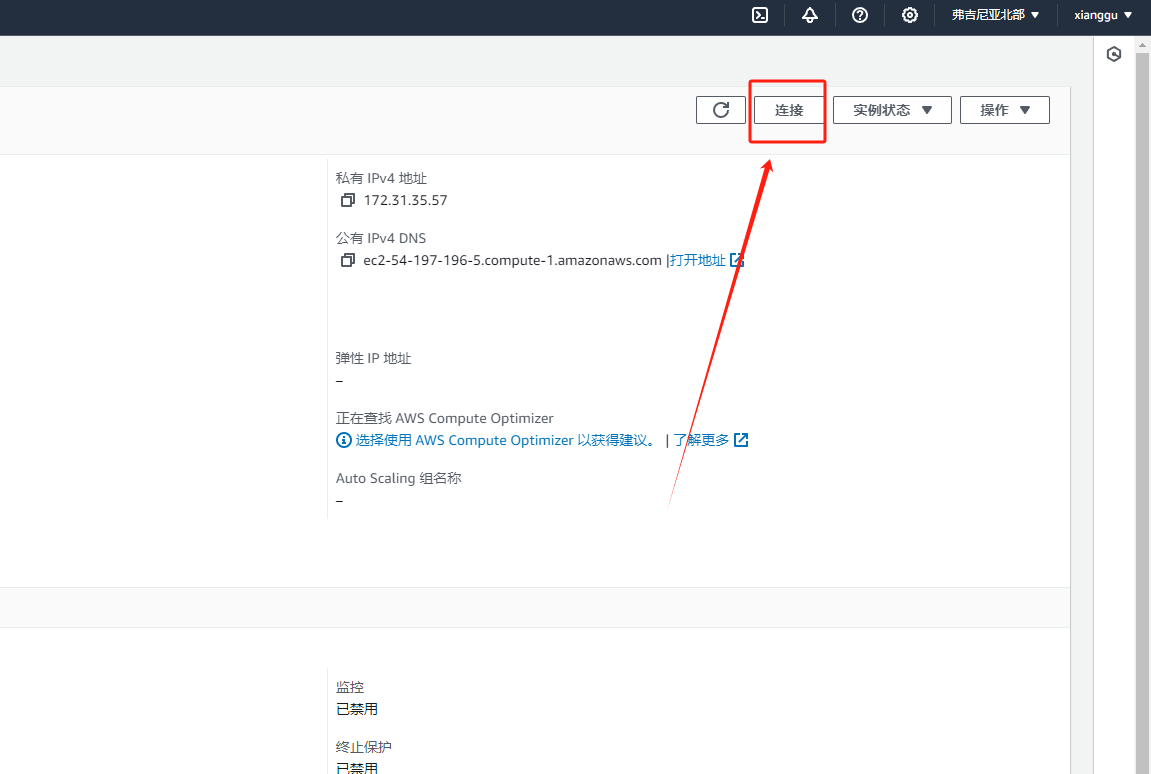
进入EC2控制台,可以看到正在运行的实例信息

关于登录到云服务实例终端,有很多种方法,最方便的是在实例详细信息右上角点击连接
可以选择使用Instance Connect 进行连接或者Instance Connect 端点进行连接,可以直接在web端进行终端控制
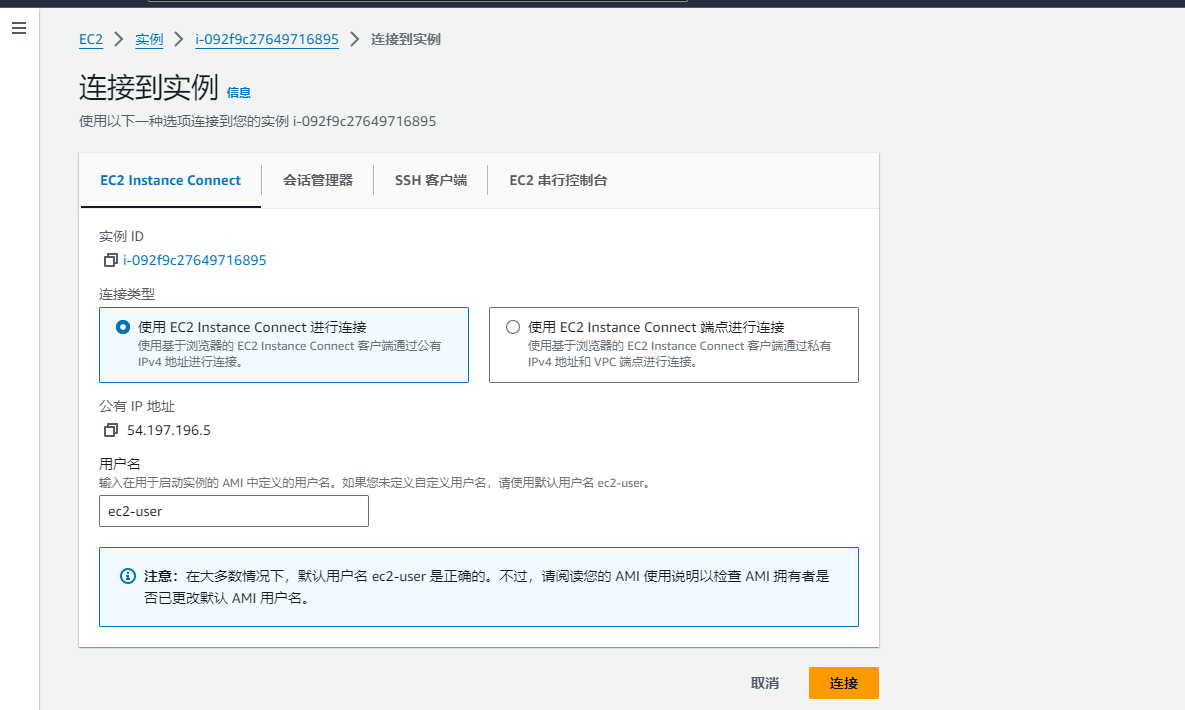
但是为了方便后续的开发部署,并不是很推荐这种方式

可以在本地安装一个shell登录软件。
2.2 EC2云服务器远程访问
常见的终端shell访问软件有Finalshell,putty,xshell等等。我这里使用的是finalshell
输入基本信息后,进行访问
tips:这里需要注意的是,初次访问现需要登录ec-user,才能继续访问root用户

登录成功后再ec-user账号下使用sudo权限设置密码
登录成功后设置root密码
sudo passwd root

3. 应用部署
3.1 安装Prometheus
# 下载
[root@ip-172-31-42-181 ~]# wget https://github.com/prometheus/prometheus/releases/download/v2.45.0/prometheus-2.45.0.linux-amd64.tar.gz


# 解压
[root@ip-172-31-42-181 ~]# tar -zxvf prometheus-2.45.0.linux-amd64.tar.gz -C /usr/local/

# 更名
[root@ip-172-31-42-181 ~]# cd /usr/local/  &&  mv prometheus-2.45.0.linux-amd64 prometheus  &&  cd prometheus
创建prometheus.service配置文件
cat >> /usr/lib/systemd/system/prometheus.service << EOF
[Unit]
Description=prometheus
After=network.target
[Service]
Type=simple
User=root
ExecStart=/usr/local/prometheus/prometheus --config.file=/usr/local/prometheus/prometheus.yml --storage.tsdb.path=/data/prometheus --storage.tsdb.retention=15d --log.level=info
Restart=on-failure
[Install]
WantedBy=multi-user.target
EOF
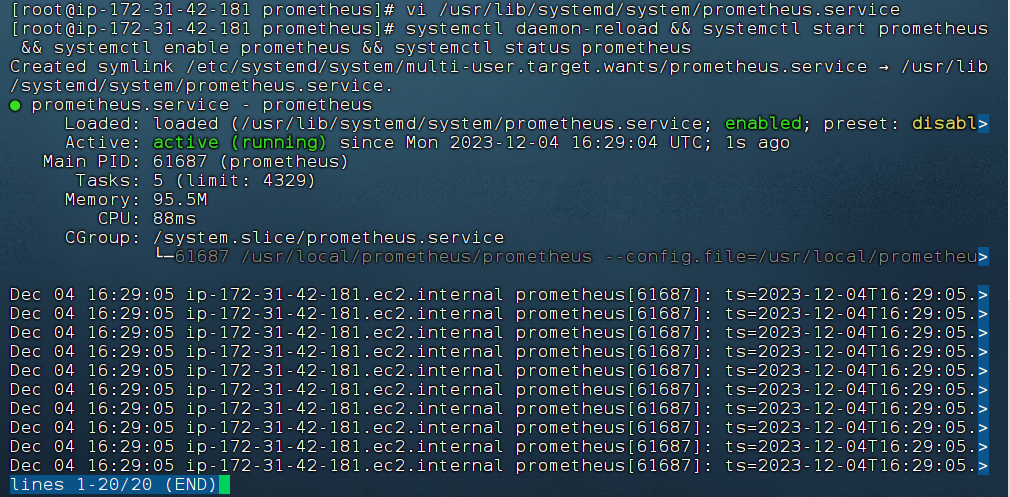
启动prometheus服务
systemctl daemon-reload && systemctl start prometheus && systemctl enable prometheus && systemctl status prometheus
3.2 安装node_exporter
下载node_exporter组件包
# 下载
[root@ip-172-31-42-181 ~]# wget https://github.com/prometheus/node_exporter/releases/download/v1.6.1/node_exporter-1.6.1.linux-amd64.tar.gz

# 解压
[root@ip-172-31-42-181 ~]# tar -zxvf node_exporter-1.6.1.linux-amd64.tar.gz -C /usr/local/

# 更名
[root@ip-172-31-42-181 ~]# cd /usr/local && mv node_exporter-1.6.1.linux-amd64 node_exporter && cd node_exporter
创建node_exporter.service配置文件
[root@ip-172-31-42-181 node_exporter]# cat > /usr/lib/systemd/system/node_exporter.service << EOF
> [Unit]
> Description=node_exporter
> Documentation=https://prometheus.io/
> After=network.target
>
> [Service]
> Type=simple
> User=root
> ExecStart=/usr/local/node_exporter/node_exporter
> Restart=on-failure
>
> [Install]
> WantedBy=multi-user.target
> EOF
启动node_exproter服务
systemctl daemon-reload && systemctl start node_exporter && systemctl enable node_exporter && systemctl status node_exporter

配置prometheus.yml文件
# my global config
global:
  scrape_interval: 15s # Set the scrape interval to every 15 seconds. Default is every 1 minute.
  evaluation_interval: 15s # Evaluate rules every 15 seconds. The default is every 1 minute.
  # scrape_timeout is set to the global default (10s).

# Alertmanager configuration
alerting:
  alertmanagers:
    - static_configs:
        - targets:
          # - alertmanager:9093

# Load rules once and periodically evaluate them according to the global 'evaluation_interval'.
rule_files:
  # - "first_rules.yml"
  # - "second_rules.yml"

# A scrape configuration containing exactly one endpoint to scrape:
# Here it's Prometheus itself.
scrape_configs:
  # The job name is added as a label `job=<job_name>` to any timeseries scraped from this config.
  - job_name: "prometheus"

    # metrics_path defaults to '/metrics'
    # scheme defaults to 'http'.

    static_configs:
      - targets: ["localhost:9090"]
  - job_name: "基于亚马逊EC2云服务器安装Prometheus数据可视化监控"

    # metrics_path defaults to '/metrics'
    # scheme defaults to 'http'.

    static_configs:
      - targets: ["18.234.153.100:9100"]
- 检验prometheus.yml配置是否有效
[root@ip-172-31-42-181 prometheus]# ./promtool check config prometheus.yml
Checking prometheus.yml
 SUCCESS: prometheus.yml is valid prometheus config file syntax
- 重启prometheus服务
systemctl daemon-reload && systemctl restart prometheus && systemctl status prometheus
- 重启node_exporter服务
systemctl daemon-reload && systemctl restart prometheus && systemctl status prometheus

3.3 访问Prometheus
- http://18.234.153.100:9090/targets

3.4 安装Grafana
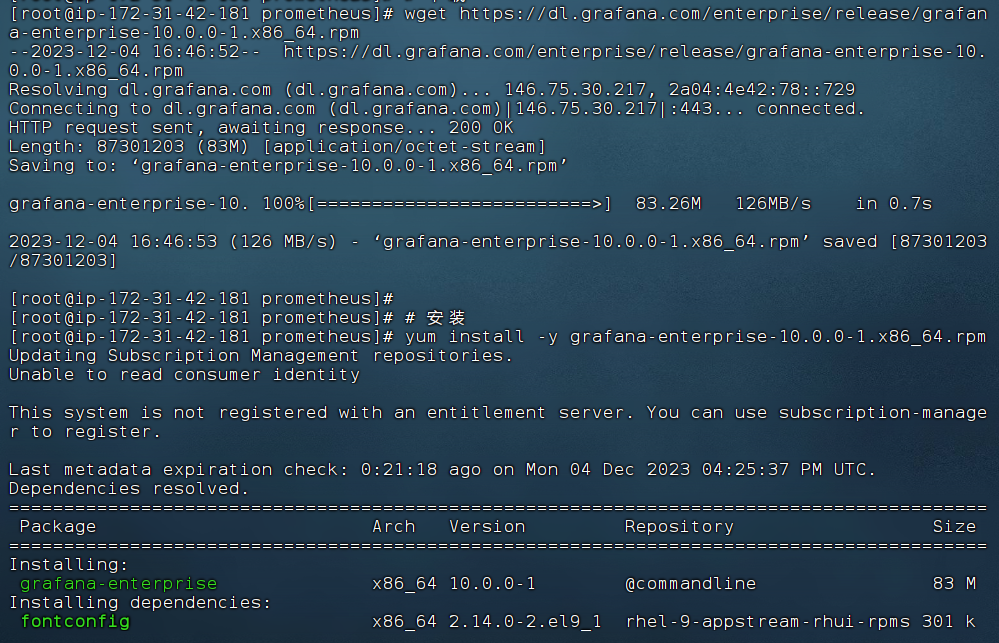
- 下载并安装Grafana
# 下载
wget https://dl.grafana.com/enterprise/release/grafana-enterprise-10.0.0-1.x86_64.rpm

# 安装
yum install -y grafana-enterprise-10.0.0-1.x86_64.rpm
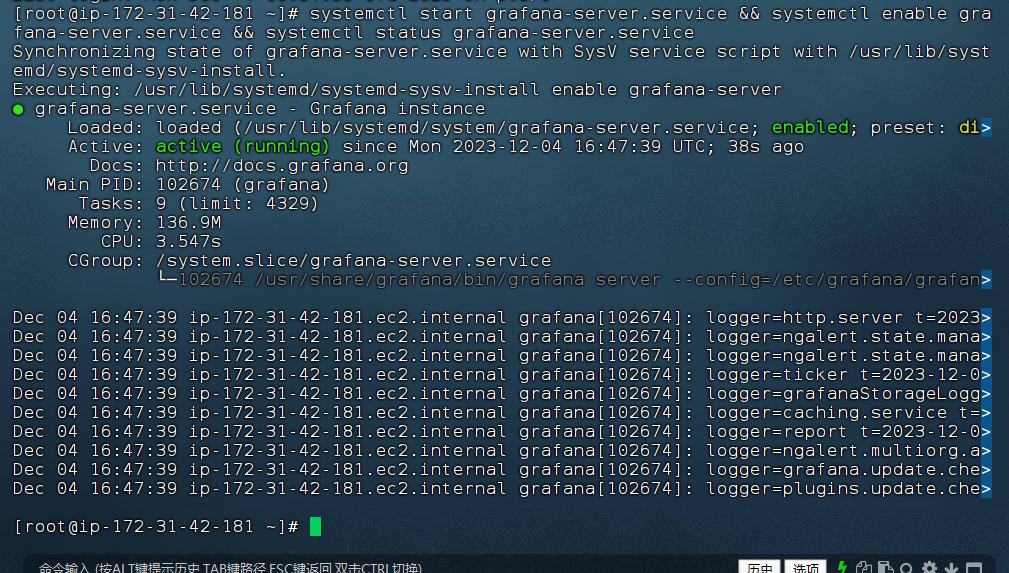
- 启动grafana服务
systemctl start grafana-server.service && systemctl enable grafana-server.service && systemctl status grafana-server.service
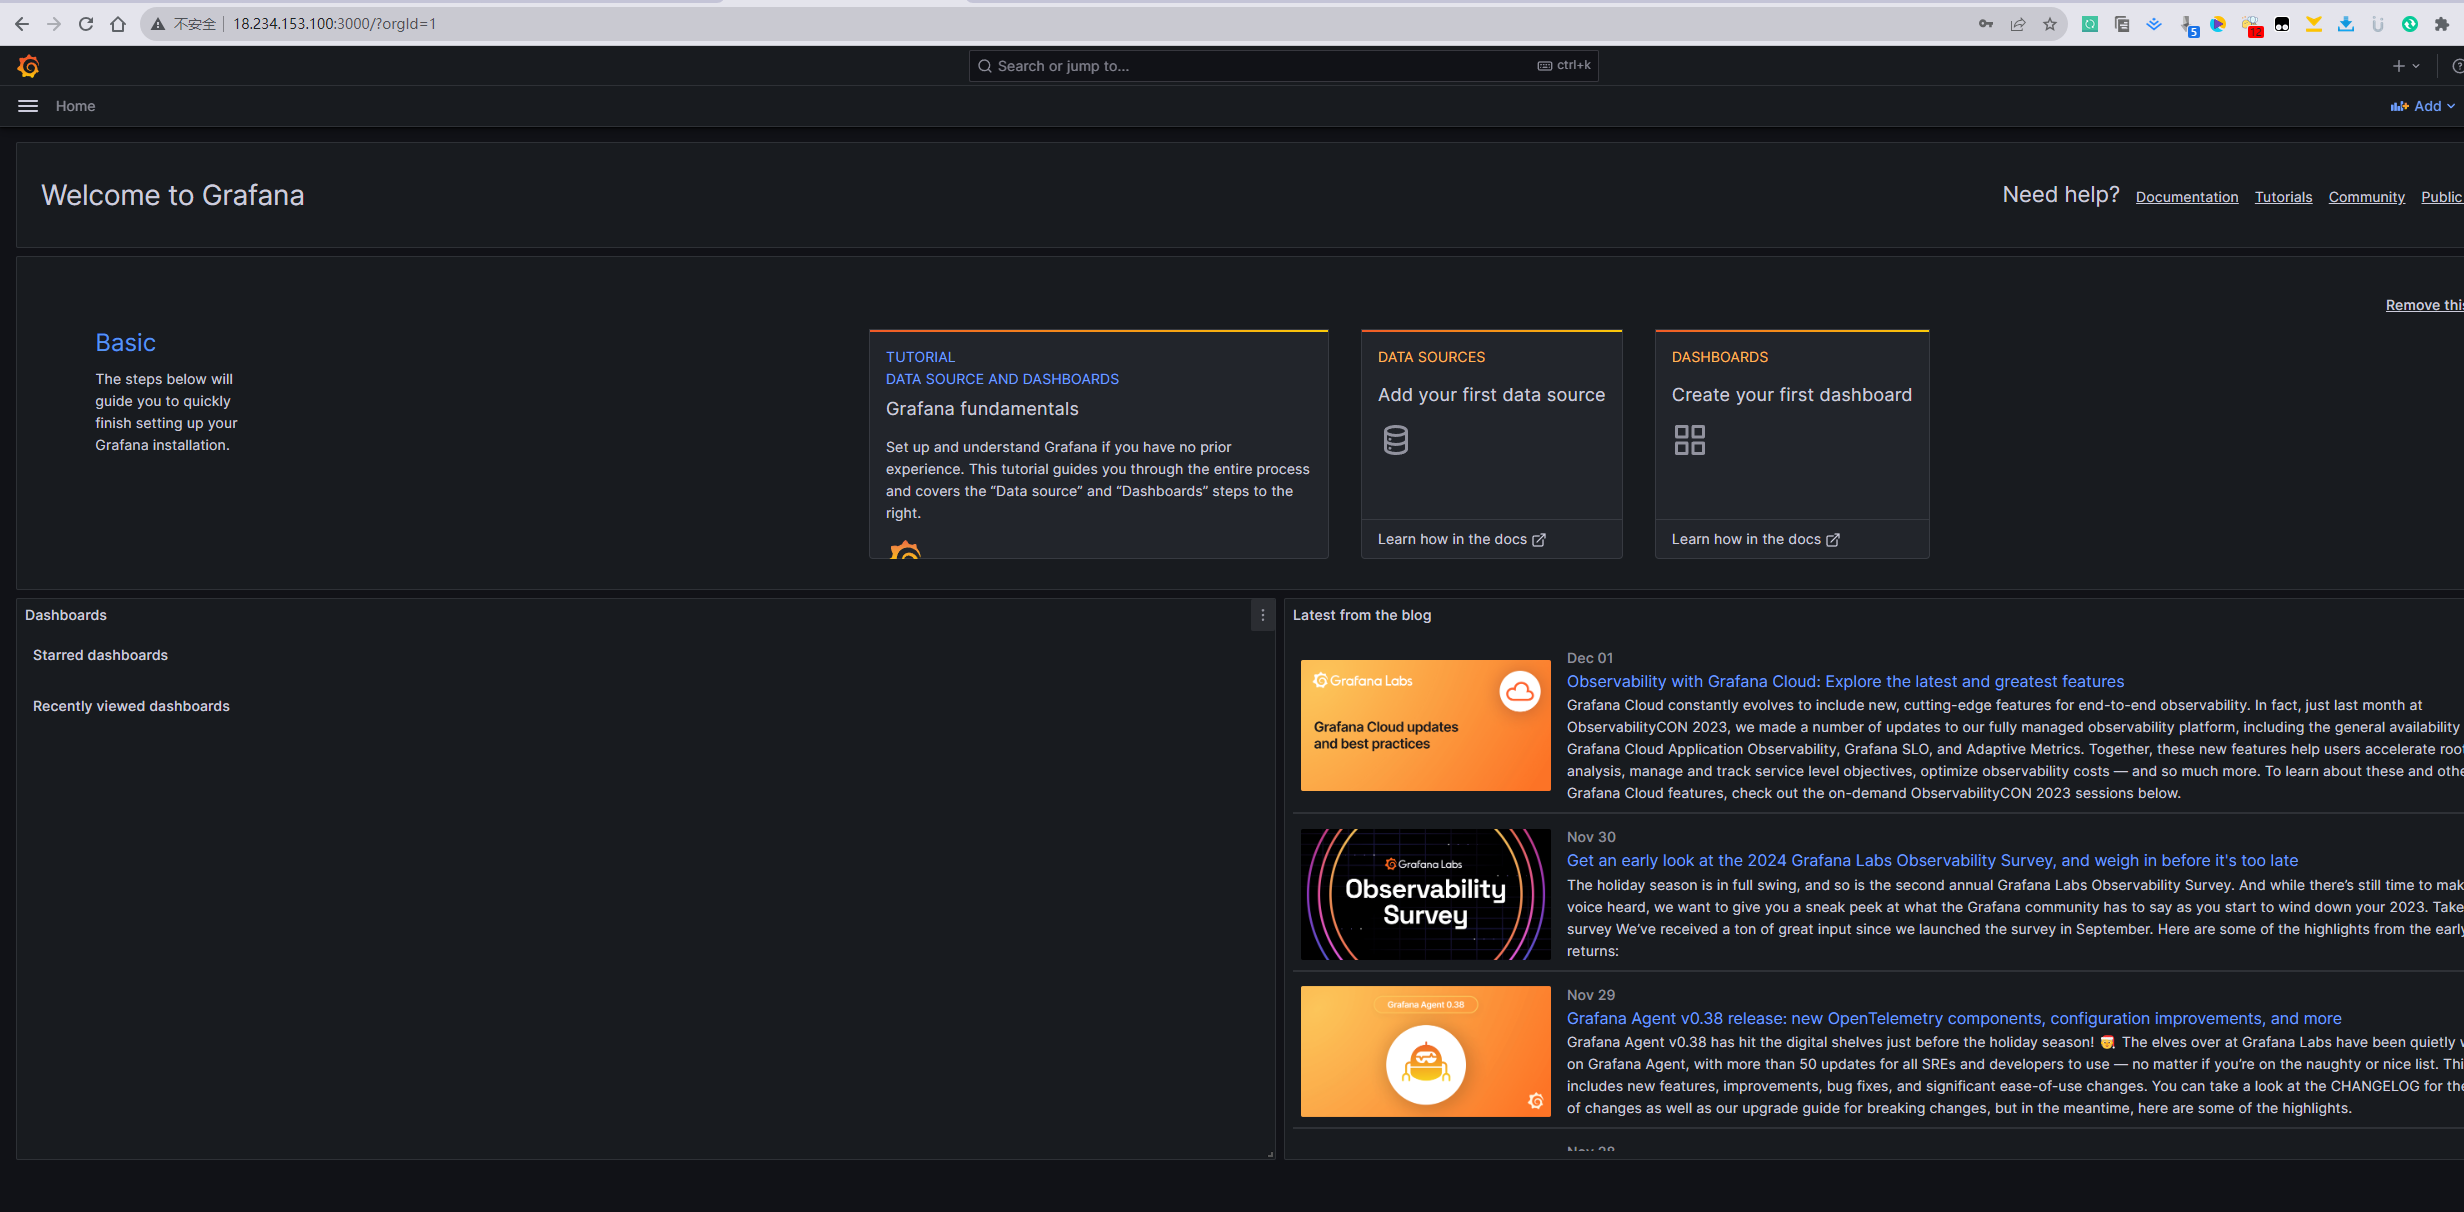
3.5 访问Grafana
http://18.234.153.100:3000

- 输入用户名和密码(初始密码:admin)
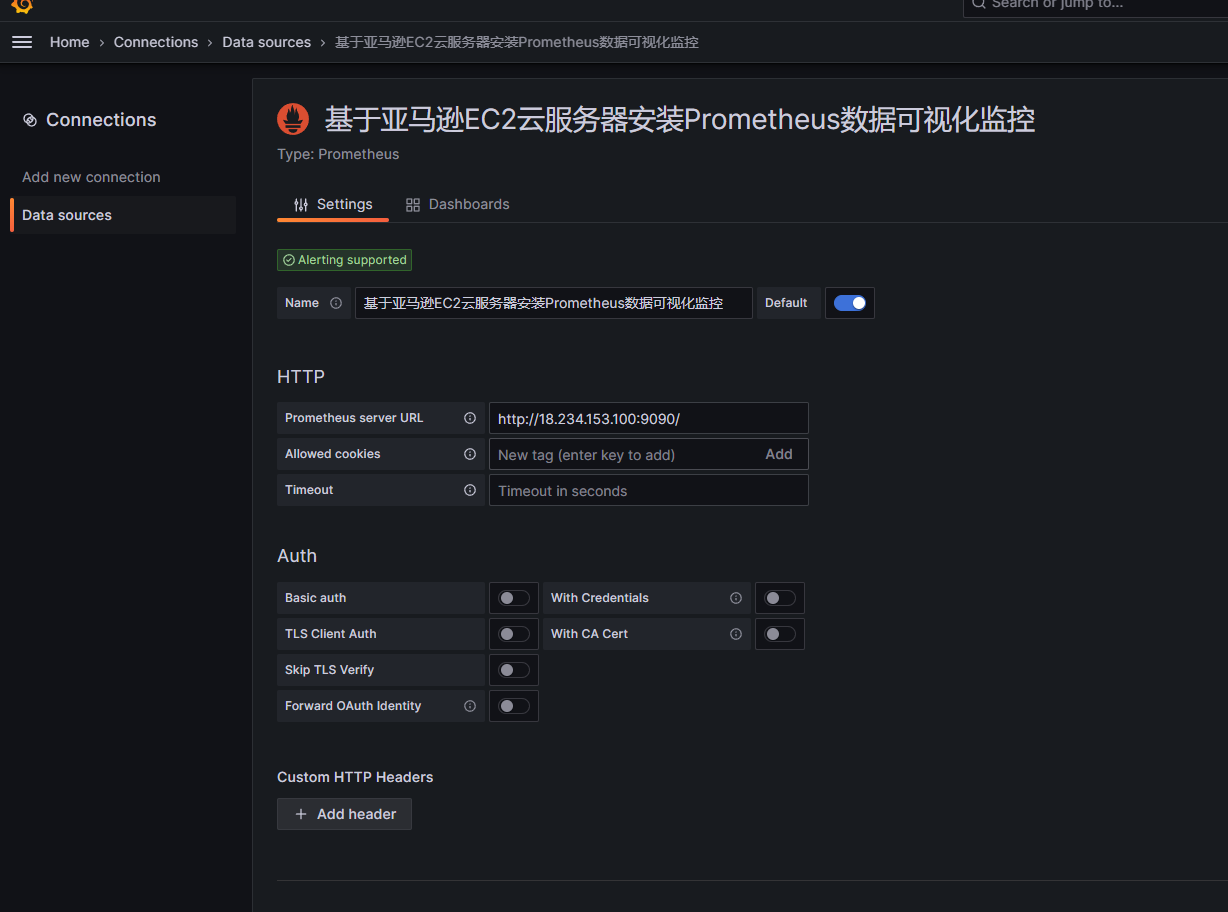
- 添加数据源Prometheus

- 导入仪表盘
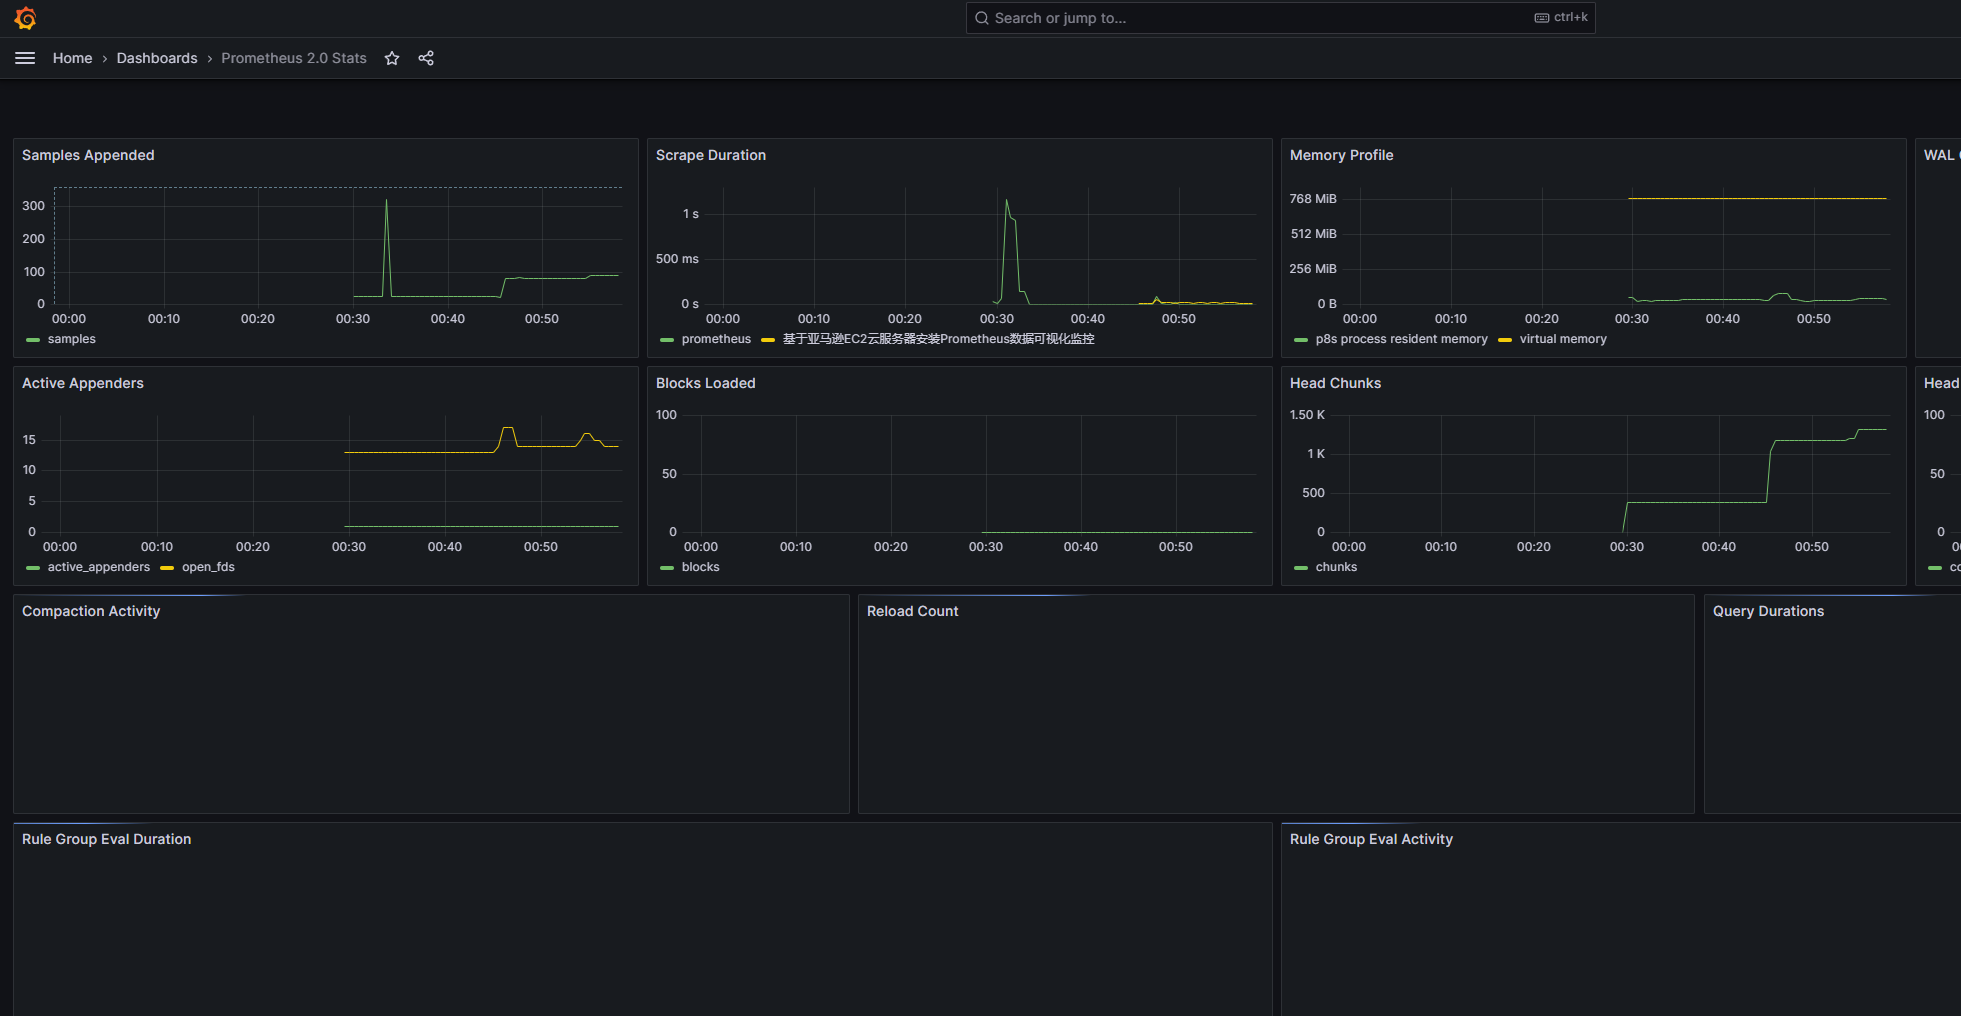
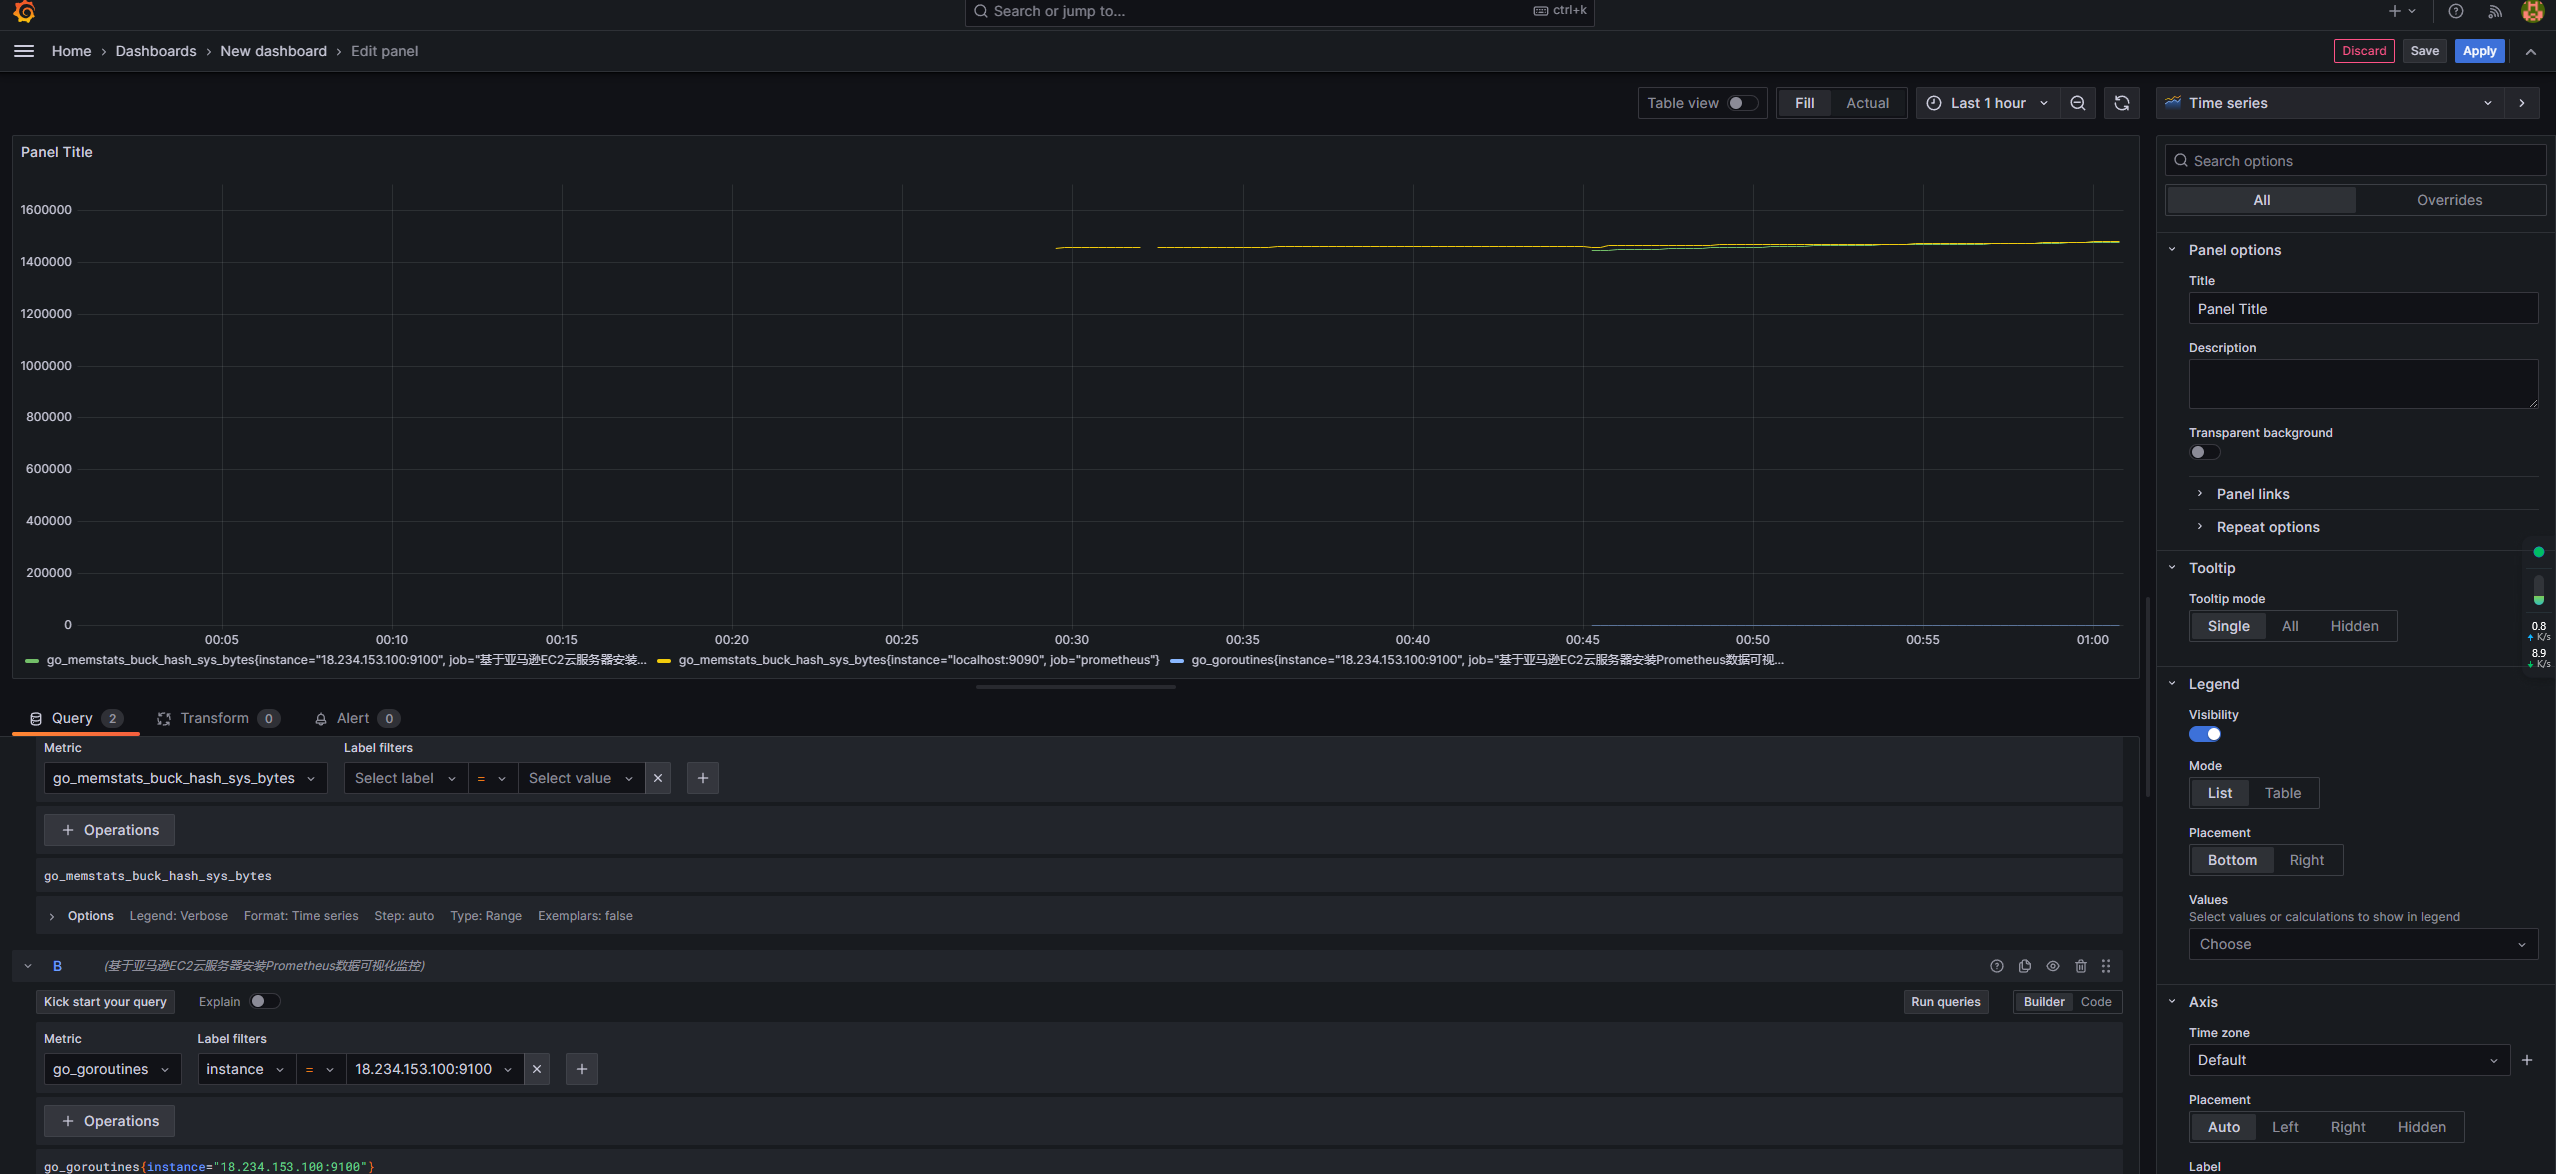
本实验基于亚马逊EC2云服务器,采用Prometheus+Grafana的安装部署方式实现对Linux系统主机的大屏监控。