vue3整合antv x6实现图编辑器快速入门
安装:
npm install @antv/x6 --save
如果使用 umd 包,可以使用下面三个 CDN 中的任何一个,默认使用 X6 的最新版:
- https://unpkg.com/@antv/x6/dist/index.js
- https://cdn.jsdelivr.net/npm/@antv/x6/dist/index.js
- https://cdnjs.cloudflare.com/ajax/libs/antv-x6/2.0.0/index.js
在页面中创建一个画布容器,然后初始化画布对象,可以通过配置设置画布的样式,比如背景颜色。
<div id="container"></div>
import { Graph } from '@antv/x6'

const graph = new Graph({
  container: document.getElementById('container'),
  width: 800,
  height: 600,
  background: {
    color: '#F2F7FA',
  },
})
X6 支持 JSON 格式数据,该对象中 nodes 代表节点数据,edges 代表边数据,可以使用 attrs 属性来定制节点和边的样式(可以类比 CSS)。
const data = {
  nodes: [
    {
      id: 'node1',
      shape: 'rect',
      x: 40,
      y: 40,
      width: 100,
      height: 40,
      label: 'hello',
      attrs: {
        // body 是选择器名称,选中的是 rect 元素
        body: {
          stroke: '#8f8f8f',
          strokeWidth: 1,
          fill: '#fff',
          rx: 6,
          ry: 6,
        },
      },
    },
    {
      id: 'node2',
      shape: 'rect',
      x: 160,
      y: 180,
      width: 100,
      height: 40,
      label: 'world',
      attrs: {
        body: {
          stroke: '#8f8f8f',
          strokeWidth: 1,
          fill: '#fff',
          rx: 6,
          ry: 6,
        },
      },
    },
  ],
  // 边:连接节点
  edges: [
    {
      shape: 'edge',
      source: 'node1', // 开始节点
      target: 'node2', // 目标节点,会建立从开始节点到目标节点的连线
      label: 'x6',
      attrs: {
        // line 是选择器名称,选中的边的 path 元素
        line: {
          stroke: '#8f8f8f',
          strokeWidth: 1,
        },
      },
    },
  ],
}
X6 支持使用 SVG、HTML 来渲染节点内容,在此基础上,我们还可以使用 React、Vue 组件来渲染节点,这样在开发过程中会非常便捷。在拿到设计稿之后,你就需要权衡一下使用哪一种渲染方式,可以参考下面的一些建议:
如果节点内容比较简单,而且需求比较固定,使用 SVG 节点
其他场景,都推荐使用当前项目所使用的框架来渲染节点
例如:在上面节点基础上,我们有一个新的需求:给节点加上右键菜单。如果使用 SVG 来实现会比较复杂,我们直接使用 React 来渲染节点。这里我们使用 X6 配套的 React 渲染包 @antv-x6-react-shape。
onMounted(() => {
const graph = new Graph({
container: document.getElementById('container'),
width: 800,
height: 600,
background: {
color: '#F2F7FA',
},
})
graph.fromJSON(data) // 渲染元素
graph.centerContent() // 居中显示
// 使用插件
graph.use(
// 自动对齐
new Snapline({
enabled: true,
}),
)
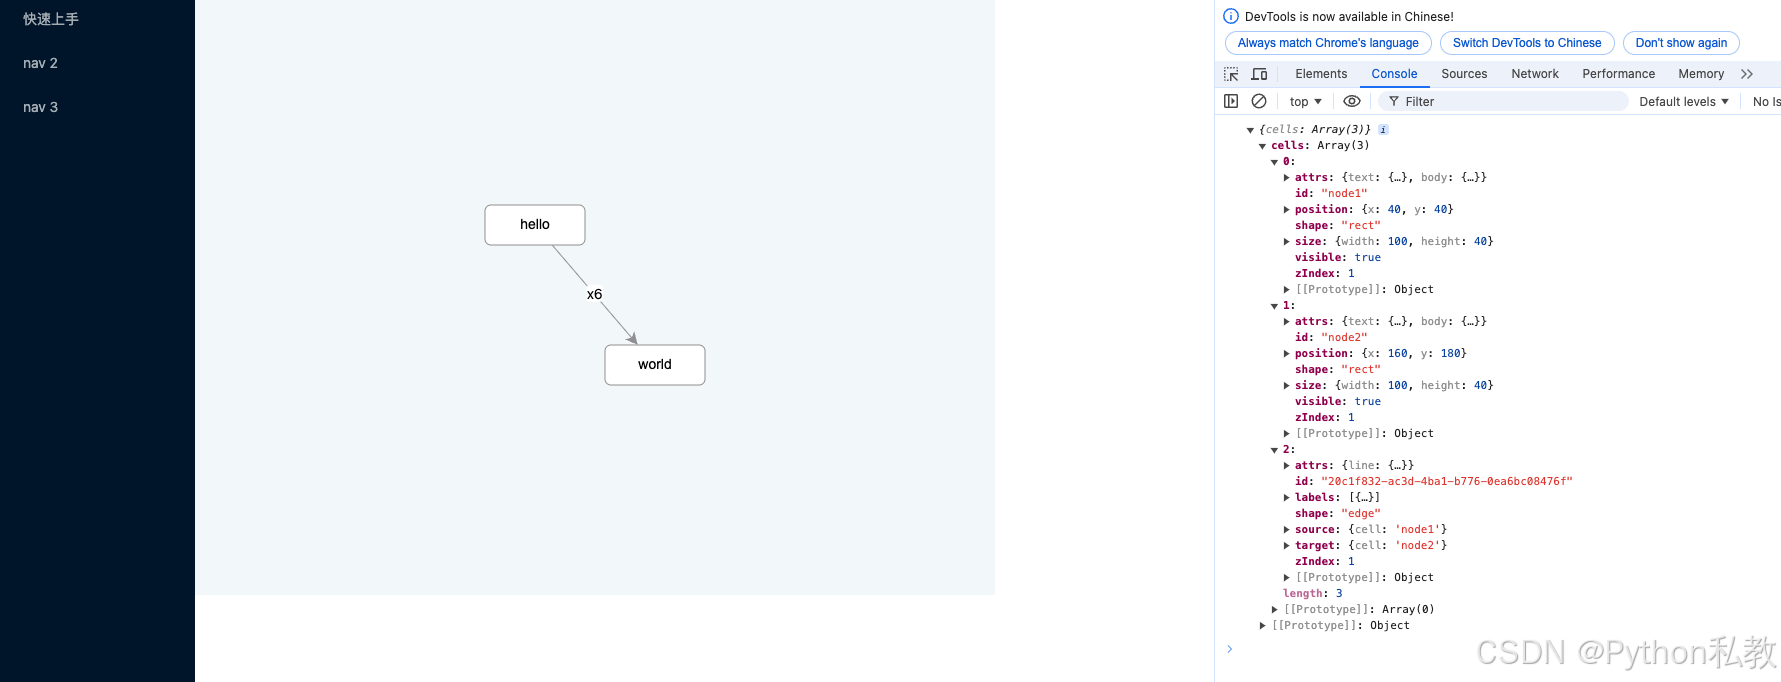
// 数据导出
console.log(graph.toJSON())
})
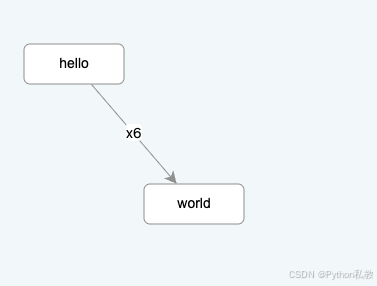
最终效果:
最终完整代码:
<script setup>
import {Graph} from '@antv/x6'
import {onMounted} from "vue";
import {Snapline} from "@antv/x6-plugin-snapline";

const data = {
  nodes: [
    {
      id: 'node1',
      shape: 'rect',
      x: 40,
      y: 40,
      width: 100,
      height: 40,
      label: 'hello',
      attrs: {
        // body 是选择器名称,选中的是 rect 元素
        body: {
          stroke: '#8f8f8f',
          strokeWidth: 1,
          fill: '#fff',
          rx: 6,
          ry: 6,
        },
      },
    },
    {
      id: 'node2',
      shape: 'rect',
      x: 160,
      y: 180,
      width: 100,
      height: 40,
      label: 'world',
      attrs: {
        body: {
          stroke: '#8f8f8f',
          strokeWidth: 1,
          fill: '#fff',
          rx: 6,
          ry: 6,
        },
      },
    },
  ],
  // 边:连接节点
  edges: [
    {
      shape: 'edge',
      source: 'node1', // 开始节点
      target: 'node2', // 目标节点,会建立从开始节点到目标节点的连线
      label: 'x6',
      attrs: {
        // line 是选择器名称,选中的边的 path 元素
        line: {
          stroke: '#8f8f8f',
          strokeWidth: 1,
        },
      },
    },
  ],
}

onMounted(() => {
  const graph = new Graph({
    container: document.getElementById('container'),
    width: 800,
    height: 600,
    background: {
      color: '#F2F7FA',
    },
  })
  graph.fromJSON(data) // 渲染元素
  graph.centerContent() // 居中显示

  // 使用插件
  graph.use(
      // 自动对齐
      new Snapline({
        enabled: true,
      }),
  )

  // 数据导出
  console.log(graph.toJSON())
})
</script>

<template>
  <div id="container"></div>
</template>

<style scoped>

</style>