UM-Net: 重新思考用于息肉分割的ICGNet,结合不确定性建模|文献速递-基于多模态-半监督深度学习的病理学诊断与病灶分割
Title
题目
UM-Net: Rethinking ICGNet for polyp segmentation with uncertainty modeling
UM-Net: 重新思考用于息肉分割的ICGNet,结合不确定性建模
01
文献速递介绍
结直肠癌(CRC)是男性中第三大、女性中第二大常见的恶性肿瘤,2020年约有一百万例新发病例,占全球癌症死亡的9.4%(Sung等,2021)。85%的结直肠癌源于结直肠腺瘤性息肉,特别是高危腺瘤(Strum和Williamson,2016)。幸运的是,如果能在结肠癌发生前及时检测并切除结直肠息肉,CRC的发病率和死亡率可以得到有效降低,5年生存率可达90%(Siegel等,2021)。在临床实践中,高质量的结肠镜检查是筛查和切除结直肠息肉的最佳方法,并被视为金标准,能够提供息肉的位置和外观信息。然而,这一过程通常由内镜医生手动进行,可能受到人为主观因素的影响,因息肉的多样性而导致漏诊。一些研究表明,结肠镜检查中息肉漏诊率高达21.4%(Kim等,2017)。因此,迫切需要一种自动且可靠的息肉分割方法,以辅助医生在诊断过程中定位息肉区域。
在不同的发育阶段,结直肠息肉的结构和特征会随时间变化(Jha等,2021)。息肉的大小不一、形状不规则、颜色和外观各异,这使得其分析具有挑战性。此外,一些因素可能会导致分割过程中的错误,如图像中的水流、肠道内容物、模糊、气泡和亮度变化等伪影(Wu等,2021)。
Abatract
摘要
Automatic segmentation of polyps from colonoscopy images plays a critical role in the early diagnosis andtreatment of colorectal cancer. Nevertheless, some bottlenecks still exist. In our previous work, we mainlyfocused on polyps with intra-class inconsistency and low contrast, using ICGNet to solve them. Due to thedifferent equipment, specific locations and properties of polyps, the color distribution of the collected images isinconsistent. ICGNet was designed primarily with reverse-contour guide information and local–global contextinformation, ignoring this inconsistent color distribution, which leads to overfitting problems and makes itdifficult to focus only on beneficial image content. In addition, a trustworthy segmentation model should notonly produce high-precision results but also provide a measure of uncertainty to accompany its predictionsso that physicians can make informed decisions. However, ICGNet only gives the segmentation result andlacks the uncertainty measure. To cope with these novel bottlenecks, we further extend the original ICGNetto a comprehensive and effective network (UM-Net) with two main contributions that have been proved byexperiments to have substantial practical value. Firstly, we employ a color transfer operation to weaken therelationship between color and polyps, making the model more concerned with the shape of the polyps.Secondly, we provide the uncertainty to represent the reliability of the segmentation results and use varianceto rectify uncertainty. Our improved method is evaluated on five polyp datasets, which shows competitiveresults compared to other advanced methods in both learning ability and generalization capability.
结肠镜图像中息肉的自动分割在结直肠癌的早期诊断和治疗中起着关键作用。然而,仍然存在一些瓶颈问题。在我们之前的工作中,主要针对类内不一致和低对比度的息肉,使用了ICGNet来解决这些问题。由于不同的设备、息肉的具体位置和特性,收集到的图像的颜色分布不一致。ICGNet主要通过反向轮廓引导信息和局部-全局上下文信息来设计,但忽视了这种不一致的颜色分布,导致了过拟合问题,使得模型难以仅专注于有用的图像内容。此外,一个可信的分割模型不仅应该产生高精度的结果,还应提供不确定性度量,以便医生能够做出更有根据的决策。然而,ICGNet仅给出了分割结果,缺乏不确定性度量。为了解决这些新出现的瓶颈,我们进一步扩展了原有的ICGNet,提出了一个综合且有效的网络(UM-Net),并通过实验验证了其具有显著的实际价值。首先,我们采用了颜色转移操作,以削弱颜色与息肉之间的关系,使模型更加关注息肉的形状。其次,我们提供了不确定性来表示分割结果的可靠性,并使用方差来修正不确定性。我们改进的方法在五个息肉数据集上进行了评估,与其他先进方法相比,在学习能力和泛化能力方面表现出竞争力。
Method
方法
3.1. Problem definition
Let 𝑇 = {(𝑋𝑖 , 𝑌𝑖 )}𝑁𝑖=1 represent the 𝑁 labeled set, where each pair( 𝑋𝑖 , 𝑌𝑖 ) consists of an image 𝑋𝑖 ∈ R𝐶×𝐻×𝑊 and its correspondingground truth 𝑌𝑖 ∈ {0, 1} 𝐻×𝑊 , where 𝐻 × 𝑊 are spatial dimensions and𝐶 is the number of channels. As discussed in the introduction, the aim isto train a segmentation network 𝐹𝑠𝑒𝑔 under solving the polyp color anduncertainty problem to obtain good performance on the test data. Inthis work, given two inputs 𝑋1 𝑎 and 𝑋2 𝑏 , the color 𝑏 of 𝑋2 𝑏 is transferredto 𝑋1 𝑎 to get the new input 𝑋1 𝑏 , which constitute the segmentationnetwork 𝐹𝑠𝑒𝑔 ( 𝑋1 𝑏 ) . We also model uncertainty in the prediction results𝑈𝑠𝑎𝑣𝑔 ( 𝐹𝑠𝑒𝑔 ( 𝑋1 𝑏 )), with 𝑠 ∈ [0, 4], while minimizing the prediction bias𝑉 𝑎𝑟 ( 𝐹𝑠𝑒𝑔 ( 𝑋1 𝑏 ) , 𝑌 1 )
3.1 问题定义
设 𝑇 = {(𝑋𝑖 , 𝑌𝑖 )}𝑁𝑖=1 代表 𝑁 个已标注的数据集,其中每一对 ( 𝑋𝑖 , 𝑌𝑖 ) 包含一个图像 𝑋𝑖 ∈ R𝐶×𝐻×𝑊 及其对应的真实标签 𝑌𝑖 ∈ {0, 1} 𝐻×𝑊,其中 𝐻 × 𝑊 为空间维度,𝐶 表示通道数。如前文所述,我们的目标是在解决息肉颜色和不确定性问题的同时,训练一个分割网络 𝐹𝑠𝑒𝑔,以在测试数据上获得良好的表现。在本工作中,给定两个输入 𝑋1 𝑎 和 𝑋2 𝑏,将 𝑋2 𝑏 的颜色 𝑏 转换到 𝑋1 𝑎,得到新的输入 𝑋1 𝑏,然后输入到分割网络 𝐹𝑠𝑒𝑔 ( 𝑋1 𝑏 )。我们还对预测结果的不确定性 𝑈𝑠𝑎𝑣𝑔 ( 𝐹𝑠𝑒𝑔 ( 𝑋1 𝑏 )) 进行建模,𝑠 ∈ [0, 4],并且在最小化预测偏差 𝑉𝑎𝑟 ( 𝐹𝑠𝑒𝑔 ( 𝑋1 𝑏 ), 𝑌* 1 ) 的同时进行优化。
Results
结果
5.1. Quantitative evaluation for metric superiority
5.1.1. Learning ability
In this section, we perform the learning ability of our approachon two datasets, and the quantitative results are shown in Tables 2and 3. Compared with ICGNet, UM-Net has improved the Dice andmIoU metrics from 87.93%, 89.56% to 89.26%, and 90.33% respectively on the EndoScene dataset, and from 92.35%, 91.99% to 93.04%,and 92.54% respectively on the Kvasir-SEG dataset. Similarly, ourmethod is superior to other advanced approaches and achieves the bestperformance, further demonstrating good model learning ability.In addition, we also conduct the complexity analysis comparingour method with other advanced methods. The indicators we compare include floating point operations (FLOPs), network parameters(Params), and frames per second (FPS). On the EndoScene dataset,the FLOPs, Params, and FPS of the UM-Net are 16.87G, 22.75M, and46 respectively, meanwhile achieving 15.62G, 22.75M, and 50 on theKvasir-SEG dataset. Although Polyp-PVT obtains the minimum valuein FLOPs, our method only increases 8.28G, and 7.66G on the twodatasets, respectively. In terms of Params, our model has fewer networkparameters than most advanced methods. Since the accuracy of polypsegmentation is crucial for physicians to produce accurate diagnosticresults, we pay more attention to the accuracy of segmentation withlittle difference in model computational complexity. Therefore, UM-Netis still considered to be the optimal model with reasonable efficiency.It is worth noting that the inference speed of our model can reachan average of 48 FPS, which can be used as an auxiliary system fordiagnosis to satisfy real-time prediction.
5.1. 定量评估指标的优越性
5.1.1. 学习能力
在本节中,我们对两个数据集进行了学习能力的评估,定量结果如表2和表3所示。与ICGNet相比,UM-Net在EndoScene数据集上的Dice系数和mIoU(平均交并比)分别从87.93%、89.56%提升至89.26%和90.33%,在Kvasir-SEG数据集上的Dice系数和mIoU分别从92.35%、91.99%提升至93.04%和92.54%。同样,我们的方法优于其他先进的方法,并取得了最佳性能,进一步证明了模型良好的学习能力。
此外,我们还进行了复杂度分析,将我们的方法与其他先进方法进行比较。我们比较的指标包括浮点运算次数(FLOPs)、网络参数(Params)和每秒帧数(FPS)。在EndoScene数据集上,UM-Net的FLOPs、Params和FPS分别为16.87G、22.75M和46;在Kvasir-SEG数据集上,它们分别为15.62G、22.75M和50。尽管Polyp-PVT在FLOPs上取得了最小值,我们的方法仅分别在两个数据集上增加了8.28G和7.66G。在Params方面,我们的模型拥有比大多数先进方法更少的网络参数。由于息肉分割的准确性对于医生生成精确的诊断结果至关重要,因此我们更注重分割的准确性,而模型计算复杂度的差异相对较小。因此,UM-Net仍被认为是具有合理效率的最佳模型。
值得注意的是,我们模型的推理速度平均可以达到48 FPS,这使其可以作为辅助诊断系统,满足实时预测的需求。
Figure
图
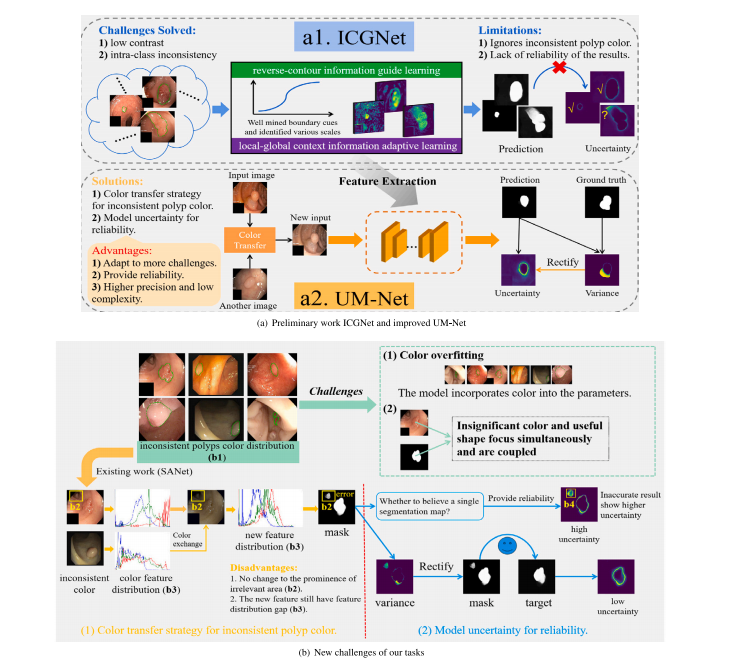
Fig. 1. Challenges and method of our framework to handle the polyps segmentation via using the colonoscopy images. From (a) to (b), they are preliminary work ICGNet and improved method UM-Net, the new challenges of our tasks, respectively
图 1. 我们框架处理通过结肠镜图像进行息肉分割的挑战与方法。从 (a) 到 (b),分别是初步工作ICGNet和改进方法UM-Net,以及我们任务面临的新挑战。
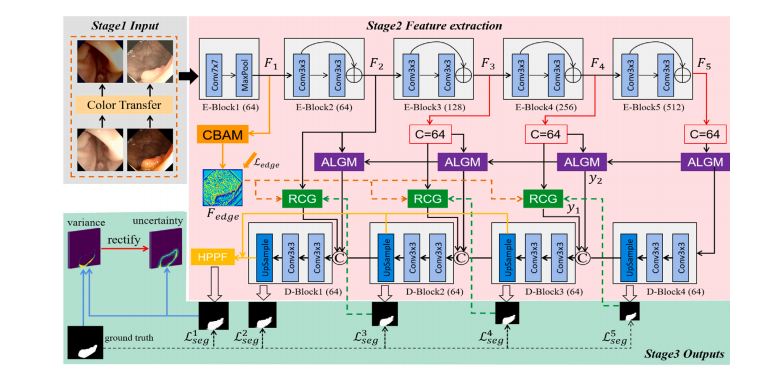
Fig. 2. Overview of the improved UM-Net. It segments the polyps and consists of three stages. Stage1 Input: By using the new polyp images after the color transfer operationas input. Stage2 Feature extraction. Stage3 Outputs: Output segmentation mask as well as corresponding uncertainty. Specifically, the RCG, ALGM, and HPPF modules refer toICGNet (Du et al., 2022)
图 2. 改进后的UM-Net概述。该网络用于息肉分割,包含三个阶段。阶段1 输入:通过颜色转换操作后的新息肉图像作为输入。阶段2 特征提取。阶段3 输出:输出分割掩码及相应的不确定性。特别地,RCG、ALGM和HPPF模块参考了ICGNet(Du等,2022)。
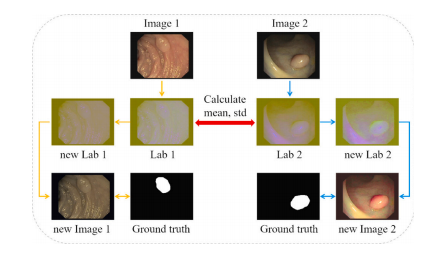
Fig. 3. One iteration of the color transfer operation.
图 3. 颜色转换操作的一次迭代流程。
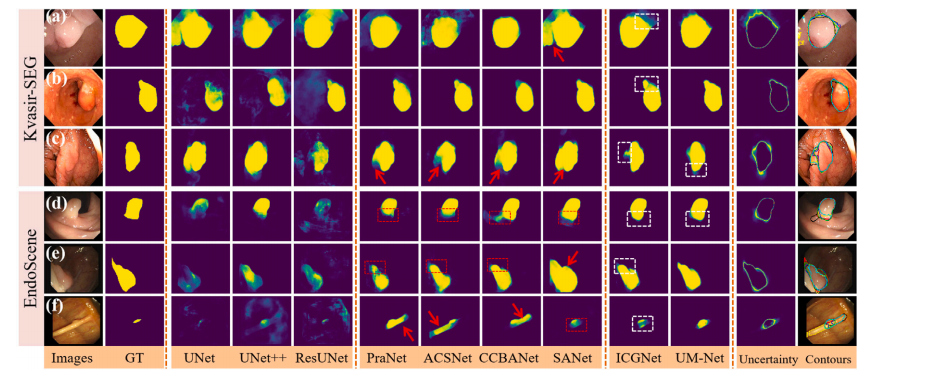
Fig. 4. Qualitative results of different methods on Kvasir-SEG and EndoScene datasets. The segmentation results are converted to contours and shown in the last column (groundtruth in red, PraNet in cyan, ACSNet in yellow, CCBANet in black, SANet in white, ICGNet in blue, UM-Net in green). In addition, the red dashed boxes indicate the misseddiagnosis area, the red arrows indicate areas that are larger than the ground truth, and the white dashed boxes show the difference between ICGNet and UM-Net predictions.
图 4. 不同方法在Kvasir-SEG和EndoScene数据集上的定性结果。分割结果被转换为轮廓并显示在最后一列(红色为真实值,青色为PraNet,黄色为ACSNet,黑色为CCBANet,白色为SANet,蓝色为ICGNet,绿色为UM-Net)。此外,红色虚线框表示漏诊区域,红色箭头指示大于真实值的区域,白色虚线框显示ICGNet和UM-Net预测结果之间的差异。
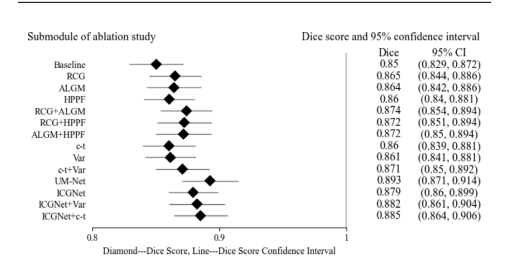
Fig. 5. Forest plot of ablation study on the EndoScene test set. Listed on the leftside are the submodules of the ablation study. On the right side are the submodulescorresponding Dice scores and 95% confidence intervals, and in the middle are theirvisual results, where diamond represents the Dice score of each submodule, and thehorizontal line connecting the diamond represents the upper and lower limits of thescore confidence interval
图 5. EndoScene测试集上消融实验的森林图。左侧列出消融实验的各个子模块,右侧为各子模块对应的Dice分数及95%置信区间,中间为它们的可视化结果,其中菱形代表每个子模块的Dice分数,连接菱形的水平线表示该分数置信区间的上下限。
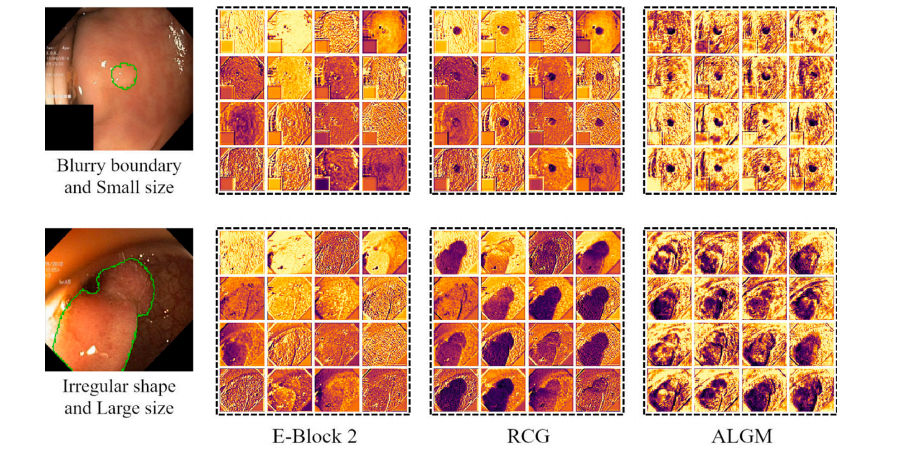
Fig. 6. Feature visualization examples of the UM-Net’s second layer. From left to right are input images (the green curve represents the outline of ground truth), the E-Block 2feature, the RCG module feature, and the ALGM module feature, respectively. After applying two modules, the network well captured missing object parts and details near theboundary, and achieved feature representation.
图 6. UM-Net第二层特征可视化示例。从左到右分别为输入图像(绿色曲线表示真实轮廓)、E-Block 2特征、RCG模块特征和ALGM模块特征。在应用这两个模块后,网络很好地捕捉到了缺失的物体部分和边界附近的细节,并实现了特征表达。
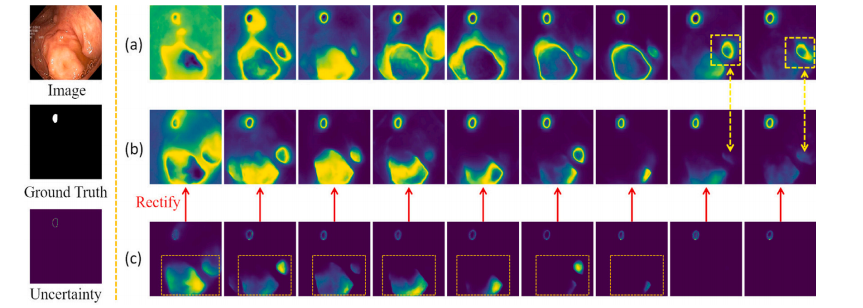
Fig. 7. Shows the variation of UM-Net modeling uncertainty as the number of training iterations continues to increase. From top to bottom on the left are the input images,the ground truth, and the corresponding uncertainty. Row (a) denotes the uncertainty output without variance rectification. Row (b) denotes the uncertainty results of variancerectification. Row (c) denotes the variance calculated between the prediction masks and the ground truth
图 7. 显示了随着训练迭代次数的增加,UM-Net建模不确定性的变化情况。左侧从上到下分别为输入图像、真实值及其对应的不确定性。(a)行表示未经过方差修正的不确定性输出。(b)行表示经过方差修正的不确定性结果。(c)行表示预测掩码与真实值之间计算的方差。
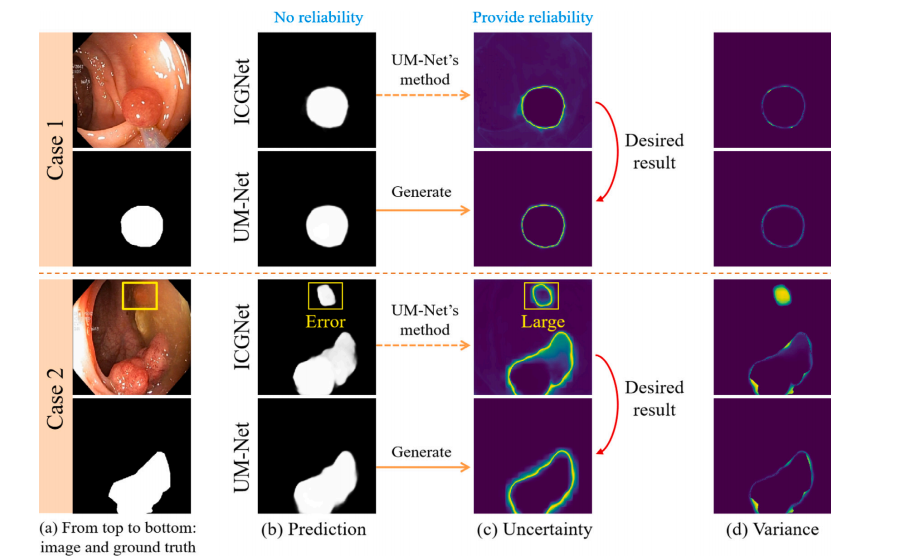
Fig. 8. Provide an evaluation of the reliability degree of the result of two cases in the test set. For each case, from left to right, the first column is the input image and itscorresponding ground truth. The second column displays the prediction for the ICGNet and UM-Net. The third column displays the uncertainty map associated with the predictionfor both models. The last column displays the variance.
图 8. 对测试集中两个案例的结果可靠性进行评估。对于每个案例,从左到右,第一列是输入图像及其对应的真实值。第二列显示ICGNet和UM-Net的预测结果。第三列显示与这两种模型预测相关的不确定性图。最后一列显示方差图。
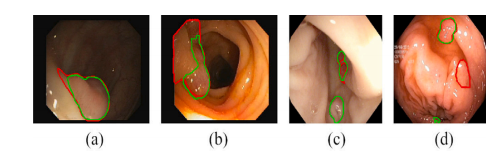
Fig. 9. Failure cases in EndoScene (a, b) and Kvasir-SEG (c, d) datasets. Green and red contours outline our prediction and ground truth of the polyp boundary
图 9. EndoScene (a, b) 和 Kvasir-SEG (c, d) 数据集中的失败案例。绿色和红色轮廓分别勾勒出我们的预测结果和息肉边界的真实值。
Table
表
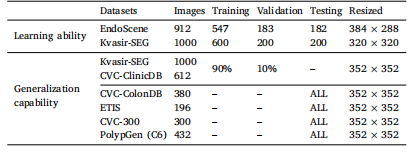
Table 1Details of the datasets for training, validation and testing.
表 1用于训练、验证和测试的数据集详情。
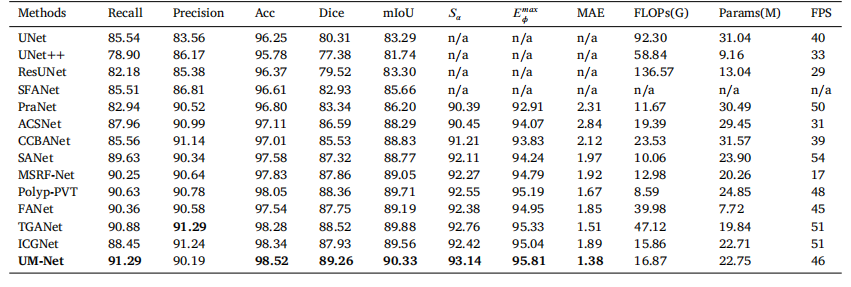
Table 2Quantitative results of the EndoScene test datasets. ‘n/a’ denotes that the results are not available.
表 2EndoScene测试数据集的定量结果。“n/a”表示结果不可用。
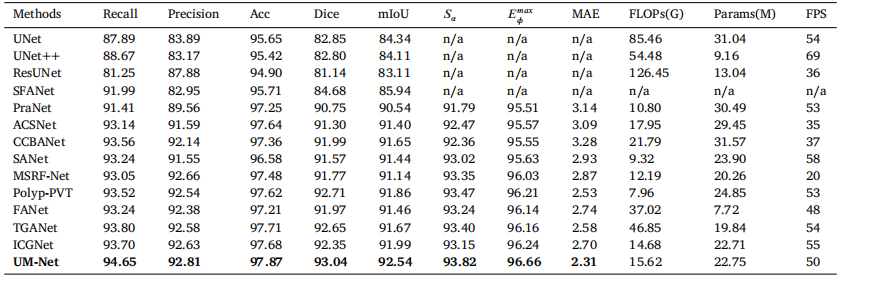
Table 3Quantitative results of the Kvasir-SEG test datasets. ‘n/a’ denotes that the results are not available.
表 3Kvasir-SEG测试数据集的定量结果。“n/a”表示结果不可用。
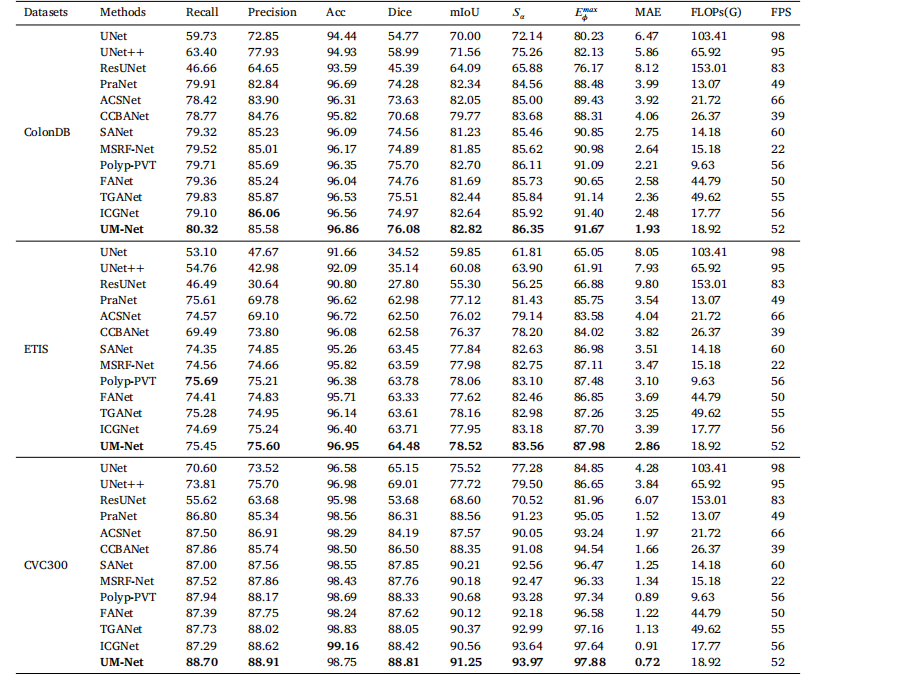
Table 4Quantitative results of the test datasets ColonDB, ETIS and CVC300.
表 4ColonDB、ETIS和CVC300测试数据集的定量结果。
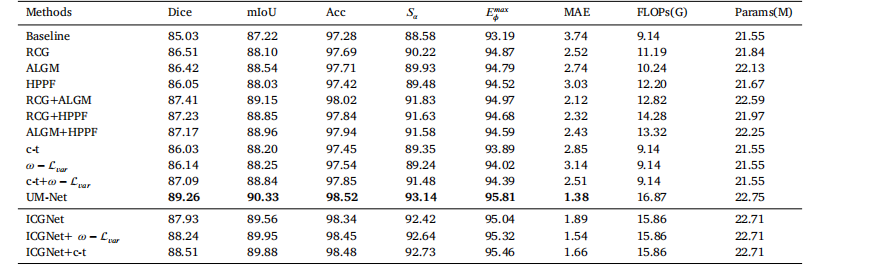
Table 5The quantitative evaluation of the ablation studies on the EndoScene test set.
表 5EndoScene测试集上消融实验的定量评估结果。
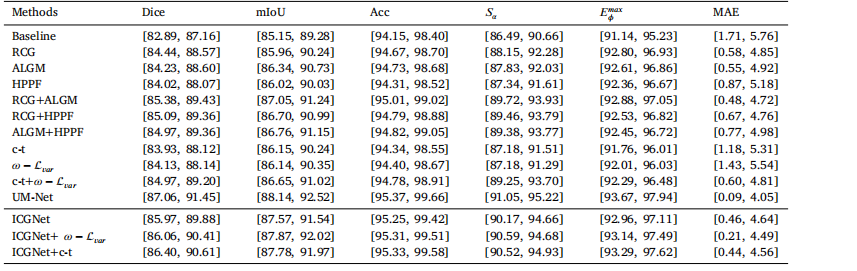
Table 695% confidence intervals for all metrics.
表 6所有指标的95%置信区间。
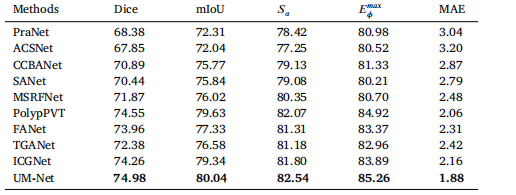
Table 7Quantitative results for a subset (C6) of the PolypGen dataset.
表 7PolypGen数据集子集(C6)的定量结果。
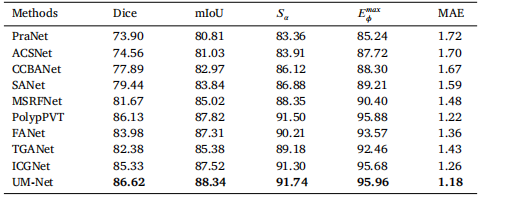
Table 8Quantitative results on CVC-300-TV dataset
表 8CVC-300-TV数据集的定量结果。