CF-Loss:用于视网膜多分类血管分割和血管特征测量的临床相关特征优化损失函数|文献速递-基于生成模型的数据增强与疾病监测应用
Title
题目
CF-Loss: Clinically-relevant feature optimised loss function for retinal multi-class vessel segmentation and vascular feature measurement
CF-Loss:用于视网膜多分类血管分割和血管特征测量的临床相关特征优化损失函数
01
文献速递介绍
视网膜血管在评估眼科疾病中的重要性已得到充分研究,例如静脉串珠现象作为诊断糖尿病视网膜病变的标志。通过临床相关的血管特征表征血管结构,还可以为全身性疾病提供有价值的见解(Wagner等,2020;Cheung等,2021;Wong和Mitchell,2004),这一领域被称为“眼基因组学”(ocularomics)(Wagner等,2020)。例如,静脉扭曲增加与高血压和体重指数升高相关(Owen等,2019;Cheung等,2011)。眼科筛查提供了一种非侵入性和经济实惠的方式来观察微血管和中枢神经系统。视网膜多分类血管分割,随后进行一系列临床特征估计,被认为是探索疾病标志物和监测眼科及全身性疾病进展的标准流程(Cheung等,2011;De Fauw等,2018;Seidelmann等,2016),如图1所示。
在过去的二十年中,设计用于临床应用和研究的血管特征测量软件工具已经多样化(Wong等,2006;Perez-Rovira等,2011;Fraz等,2015;Shi等,2022;Zhou等,2022)。新加坡I号血管评估系统(SIVA)(Wong等,2006)被用于证明较大的视网膜静脉口径与新加坡马来眼研究中的中风风险相关。视网膜图像血管评估和测量平台(VAMPIRE)(Perez-Rovira等,2011)验证了较低的分形维数与英国生物库队列研究中的白蛋白尿发生率增加相关。其他近期的软件,如视网膜血管拓扑结构和大小的定量分析(QUARTZ),致力于将先进的分割方法转化为精确的特征测量(Fraz等,2015;Zhou等,2022;Shi等,2022)。例如,开源的自动化视网膜血管形态定量(AutoMorph)使用的分割方法在多分类血管分割中实现了最先进的性能(Zhou等,2022)。所有这些软件工具(SIVA,VAMPIRE,QUARTZ,AutoMorph等)都基于视网膜多分类血管图来测量血管特征。经验上,准确的分割图对于获得精确的特征至关重要。为了实现准确的血管特征,最近大量的研究集中在多分类血管分割上(Mookiah等,2021;Chen等,2021a;You等,2022)。
Aastract
摘要
Characterising clinically-relevant vascular features, such as vessel density and fractal dimension, can benefitbiomarker discovery and disease diagnosis for both ophthalmic and systemic diseases. In this work, weexplicitly encode vascular features into an end-to-end loss function for multi-class vessel segmentation,categorising pixels into artery, vein, uncertain pixels, and background. This clinically-relevant feature optimisedloss function (CF-Loss) regulates networks to segment accurate multi-class vessel maps that produce precisevascular features. Our experiments first verify that CF-Loss significantly improves both multi-class vesselsegmentation and vascular feature estimation, with two standard segmentation networks, on three publiclyavailable datasets. We reveal that pixel-based segmentation performance is not always positively correlatedwith accuracy of vascular features, thus highlighting the importance of optimising vascular features directly viaCF-Loss. Finally, we show that improved vascular features from CF-Loss, as biomarkers, can yield quantitativeimprovements in the prediction of ischaemic stroke, a real-world clinical downstream task.
表征临床相关的血管特征,如血管密度和分形维数,有助于生物标志物的发现和眼科及全身性疾病的诊断。在这项工作中,我们将血管特征显式编码到一个端到端的损失函数中,用于多分类血管分割,将像素分为动脉、静脉、不确定像素和背景。这个临床相关特征优化损失函数(CF-Loss)可以调控网络,以分割出准确的多分类血管图,从而产生精确的血管特征。我们的实验首先验证了在两个标准分割网络和三个公开数据集上,CF-Loss显著提高了多分类血管分割和血管特征估计的精度。我们揭示了基于像素的分割性能并不总是与血管特征的准确性呈正相关,从而强调了通过CF-Loss直接优化血管特征的重要性。最后,我们展示了CF-Loss优化的血管特征作为生物标志物,在预测缺血性中风这一真实的临床下游任务中带来了定量的改进。
Method
方法
We explicitly encode the vascular features as end-to-end loss functions, as shown in Fig. 2. Among a wide range of informative vascularfeatures (Zhou et al., 2022; Wagner et al., 2020), we focus on two specific features: vessel density and fractal dimension (box count), whichwe favour for their computational efficiency. However, the conceptextends to other image-based vascular features.We denote 𝑆, 𝑇 ∈ [0, 1] ℎ×𝑤 as a segmentation map and a groundtruth map respectively, where ℎ and 𝑤 indicate the height and widthof the image.
我们将血管特征显式编码为端到端的损失函数,如图2所示。在众多具有信息量的血管特征中(Zhou等,2022;Wagner等,2020),我们重点关注两个特定特征:血管密度和分形维数(盒子计数),因为它们在计算上具有较高的效率。然而,这一概念可以扩展到其他基于图像的血管特征。我们将𝑆, 𝑇 ∈ [0, 1] ℎ×𝑤表示为分割图和真实标签图,其中ℎ和𝑤分别表示图像的高度和宽度。
Conclusion
结论
We introduce a new feature-based loss function that directly encodes computation of downstream vascular features used as clinicaldisease markers, to optimise segmentation networks. We combine theproposed feature-based loss and pixel-based loss as CF-Loss. Experimental results show that CF-Loss improved both multi-class vesselsegmentation and vascular feature measurement, compared to threerecent loss functions which consider only the interim segmentationrather than the final feature. In particular, the combination of 𝐿𝑜𝑠𝑠𝐶𝐹−𝐵and BF-Net achieved the best results in feature measurement. With CFLoss, both artery and vein segmentation have been improved, as shownin Table 4 and Table 5. We also conduct three ablation study to showthe efficacy of designed components, including single loss function andbox size weight. The analysis of segmentation metrics vs. feature agreement (Section 4.4.6) highlights the significance of optimising featuresdirectly, with CF-Loss proposed in this work. For the loss weight 𝜆and 𝛽 respectively for 𝐿𝑜𝑠𝑠𝐶𝐹−𝐵 and 𝐿𝑜𝑠𝑠𝐶𝐹−𝑉 , there appears to bea trade-off of further optimising pixel-based segmentation metrics andvascular feature agreement. In scenarios that require accurate featuresfor clinical downstream tasks, such as the ischaemic stroke prediction,the 𝐿𝑜𝑠𝑠𝐶𝐹−𝐵 is preferred.
我们引入了一种新的基于特征的损失函数,直接对下游血管特征(作为临床疾病标志物)进行计算编码,以优化分割网络。我们将所提出的基于特征的损失函数与基于像素的损失函数结合为CF-Loss。实验结果表明,与仅考虑中间分割而非最终特征的三种最新损失函数相比,CF-Loss在多分类血管分割和血管特征测量方面均有所提升。特别是𝐿𝑜𝑠𝑠𝐶𝐹−𝐵与BF-Net的结合在特征测量上取得了最佳结果。使用CF-Loss后,动脉和静脉分割都得到了改善,如表4和表5所示。我们还进行了三项消融研究,以展示设计组件的有效性,包括单一损失函数和盒子大小权重。分割指标与特征一致性的分析(第4.4.6节)强调了直接优化特征的重要性,这是本文提出的CF-Loss的核心。在损失权重𝜆和𝛽(分别用于𝐿𝑜𝑠𝑠𝐶𝐹−𝐵和𝐿𝑜𝑠𝑠𝐶𝐹−𝑉)的优化中,像素级分割指标和血管特征一致性之间存在权衡。在需要准确特征用于临床下游任务的场景中,如缺血性中风预测,𝐿𝑜𝑠𝑠𝐶𝐹−𝐵更为理想。
Figure
图
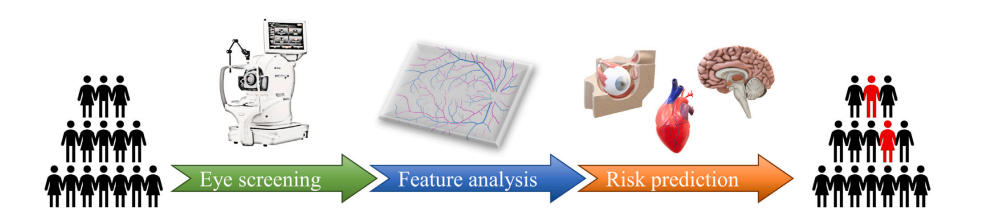
Fig. 1. Pipeline of employing retinal vascular features for ophthalmic and systemic disease monitoring, including risk prediction of cardiovascular and neurodegenerative diseases.After successive operations of eye screening, feature analysis, and risk prediction, the individuals at high risk of ocular and systemic diseases (highlighted in red) are identifiedfrom a large cohort. Feature analysis includes multi-class vessel segmentation and vascular feature measurement, which substantially affect reliability and robustness.
图1. 利用视网膜血管特征进行眼科和全身性疾病监测的流程,包括心血管和神经退行性疾病风险预测。经过眼科筛查、特征分析和风险预测的连续操作,从大量人群中识别出眼科和全身性疾病的高风险个体(红色突出显示)。特征分析包括多分类血管分割和血管特征测量,这对分析的可靠性和稳健性有着重要影响。
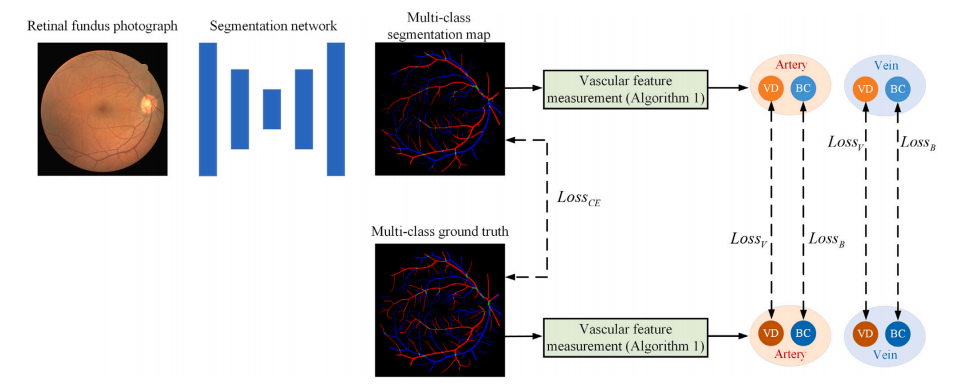
Fig. 2. Schematic of the proposed loss function CF-Loss. We measure two vascular features with Algorithm 1 and encode them into loss functions, the vessel density loss 𝐿𝑜𝑠𝑠𝑉(Eq. (2)) and box count loss 𝐿𝑜𝑠𝑠𝐵 (Eq. (6)), to regulate the segmentation network to accurately segment vessel maps specifically to derive accurate fractal dimension and vesseldensity.
图2. 所提出的CF-Loss损失函数的示意图。我们使用算法1测量两个血管特征,并将它们编码为损失函数,即血管密度损失𝐿𝑜𝑠𝑠𝑉(方程(2))和盒子计数损失𝐿𝑜𝑠𝑠𝐵(方程(6)),从而调控分割网络,精确分割血管图,特别是为了推导出准确的分形维数和血管密度。
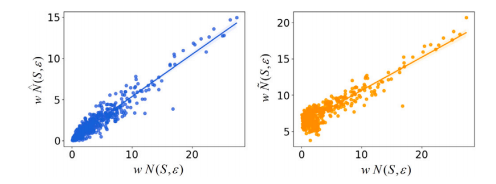
Fig. 3. Linear regression of𝐿𝑜𝑠𝑠𝐵 with (𝑤) different box counts. 𝑥 axis is𝐿𝑜𝑠𝑠𝐵 withraw box count 𝑁(𝑆, 𝜀) and 𝑦 axis with the first soft box count 𝑁̂ (𝑆, 𝜀) (left side) andthe second soft box count 𝑁̃ (𝑆, 𝜀) (right side)
图3. 𝐿𝑜𝑠𝑠𝐵与不同盒子计数(𝑤)的线性回归。𝑥轴表示的是原始盒子计数𝑁(𝑆, 𝜀)的𝐿𝑜𝑠𝑠𝐵,𝑦轴分别表示第一个软盒子计数𝑁̂ (𝑆, 𝜀)(左侧)和第二个软盒子计数𝑁̃ (𝑆, 𝜀)(右侧)。
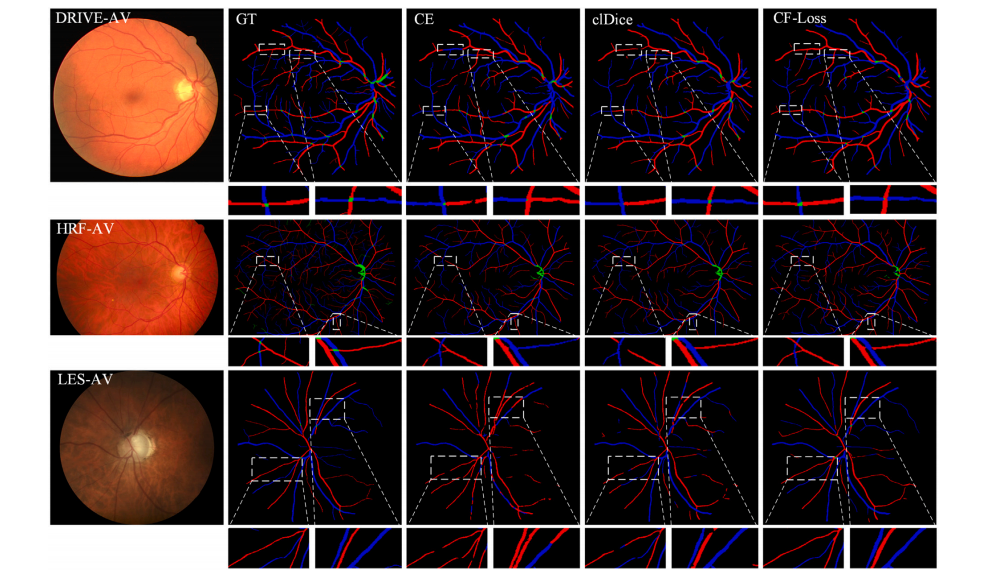
Fig. 4. Visualisation examples on DRIVE-AV, HRF-AV, and LES-AV. From left to right are colour fundus photographs, ground-truth map, segmentation with cross entropy, withclDice, and with a representative of proposed CF-Loss (𝐿𝑜𝑠𝑠𝐶𝐹−𝐵 in Eq. (7)). Local comparisons are highlighted in the white dash boxes.
图4. 在DRIVE-AV、HRF-AV和LES-AV数据集上的可视化示例。从左到右依次为彩色眼底照片、真实标签图、交叉熵分割结果、clDice分割结果,以及使用所提出的CF-Loss的代表性分割结果(𝐿𝑜𝑠𝑠𝐶𝐹−𝐵,见方程(7))。局部比较在白色虚线框中突出显示。
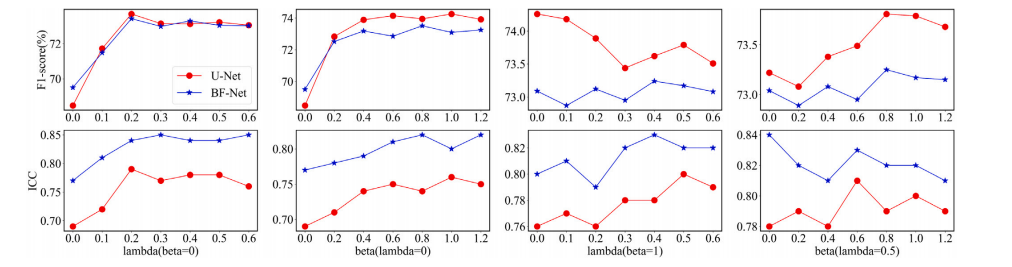
Fig. 5. Performance on DRIVE-AV with different 𝜆 and 𝛽 values for the CF-Loss 𝐿𝑜𝑠𝑠𝐶𝐹−𝐵 in first column, 𝐿𝑜𝑠𝑠**𝐶𝐹−𝑉 in second column, and 𝐿𝑜𝑠𝑠𝐶𝐹−𝑉 𝐵* in last two columns. Firstrow indicates F1-score and second row shows the agreement of fractal dimension ICCF to ground truth.
图5. 在DRIVE-AV数据集上,不同𝜆和𝛽值对CF-Loss的影响。第一列为𝐿𝑜𝑠𝑠𝐶𝐹−𝐵,第二列为𝐿𝑜𝑠𝑠𝐶𝐹−𝑉,最后两列为𝐿𝑜𝑠𝑠𝐶𝐹−𝑉𝐵。第一行显示了F1得分,第二行显示了分形维数ICCF与真实标签的匹配度。
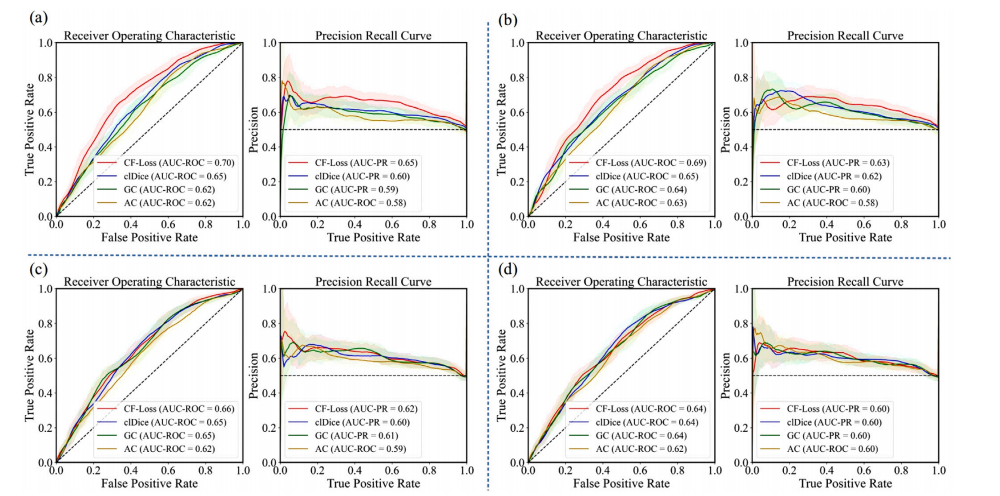
Fig. 6. ROC and PR curves for predicting stroke incidence with (a) artery fractal dimension, (b) artery vessel density, (c) vein fractal dimension, and (d) vein vessel density fromdifferent segmentation loss functions. AUC-ROC and AUC-PR are listed in legends. Bootstrapped confidence intervals, [5th, 95th] percentiles of AUC-ROC and AUC-PR, are plottedin corresponding colour shades
图6. 使用不同分割损失函数预测中风发生率的ROC曲线和PR曲线,分别展示:(a) 动脉分形维数,(b) 动脉血管密度,(c) 静脉分形维数,(d) 静脉血管密度。图例中列出了AUC-ROC和AUC-PR值。以对应的颜色阴影绘制了AUC-ROC和AUC-PR的引导置信区间,[第5,第95]百分位数。

Fig. 7. Performance comparison between 𝐿𝑜𝑠𝑠𝐶𝐹−𝐵 with- and without box size weight, as well as using first soft box count 𝑁̂ (𝑆, 𝜀) on DRIVE-AV dataset.
图7. 在DRIVE-AV数据集上,𝐿𝑜𝑠𝑠𝐶𝐹−𝐵在有无盒子大小权重情况下的性能比较,以及使用第一个软盒子计数𝑁̂ (𝑆, 𝜀)的表现对比。
Table
表
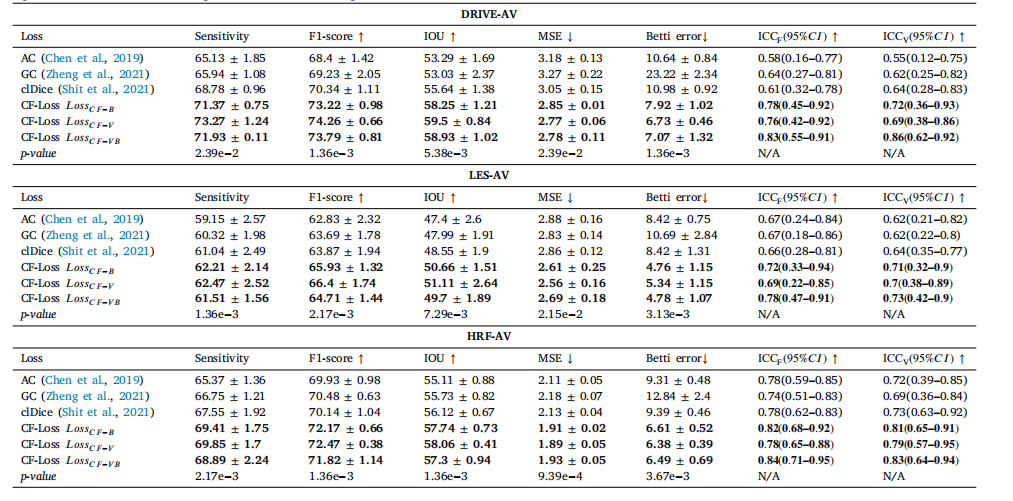
Table 1Multi-class segmentation performance with U-Net on DRIVE-AV, LES-AV, and HRF-AV. Betti error evaluates the topological correctness of segmentation maps. ICCF evaluate theagreement of fractal dimension to that derived from ground-truth maps and ICCV for vessel density. p-value of Mann–Whitney U test between CF-Loss 𝐿𝑜𝑠𝑠 𝐶𝐹−𝐵 and clDice isreported, as clDice is the most competitive loss function among others.
表1 U-Net在DRIVE-AV、LES-AV和HRF-AV数据集上的多分类分割性能。Betti误差用于评估分割图的拓扑正确性。ICCF用于评估分形维数与真实标签图计算的分形维数的一致性,ICCV用于评估血管密度的一致性。报告了CF-Loss 𝐿𝑜𝑠𝑠𝐶𝐹−𝐵 与clDice之间Mann-Whitney U检验的p值,因为clDice是与其他损失函数相比最具竞争力的损失函数。
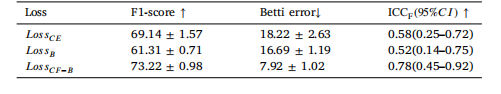
Table 2Effects of single loss function on multi-class vessel segmentation performance with UNet on DRIVE-AV dataset. 𝐿𝑜𝑠𝑠𝐵 indicates box count loss only and 𝐿𝑜𝑠𝑠𝐶𝐹−𝐵 is withthe combination of cross entropy and 𝐿𝑜𝑠𝑠𝐵 , as introduced in Eq. (7)
表2 单一损失函数对DRIVE-AV数据集上UNet多分类血管分割性能的影响。𝐿𝑜𝑠𝑠𝐵 表示仅使用盒子计数损失,而𝐿𝑜𝑠𝑠𝐶𝐹−𝐵 是结合了交叉熵和𝐿𝑜𝑠𝑠𝐵,如方程(7)中所介绍的。
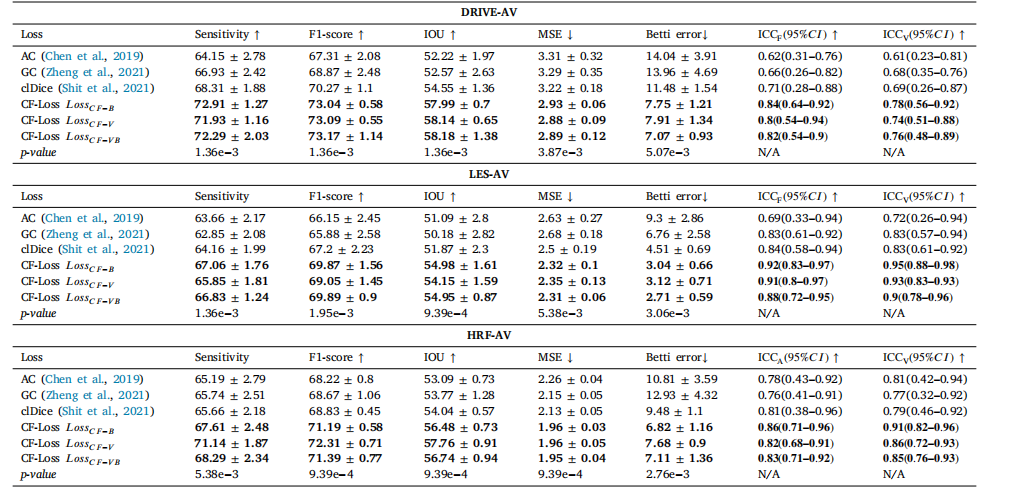
Table 3Multi-class segmentation performance with BF-Net on DRIVE-AV, LES-AV, and HRF-AV. Betti error evaluates the topological correctness of segmentation maps. ICCF evaluate theagreement of fractal dimension to that derived from ground-truth maps and ICCV for vessel density. p-value of Mann–Whitney U test between CF-Loss 𝐿𝑜𝑠𝑠𝐶𝐹−𝐵 and clDice isreported, as clDice is the most competitive loss function among others
表3BF-Net在DRIVE-AV、LES-AV和HRF-AV数据集上的多分类分割性能。Betti误差用于评估分割图的拓扑正确性。ICCF用于评估分形维数与真实标签图计算的分形维数的一致性,ICCV用于评估血管密度的一致性。报告了CF-Loss 𝐿𝑜𝑠𝑠𝐶𝐹−𝐵 与clDice之间Mann-Whitney U检验的p值,因为clDice是与其他损失函数相比最具竞争力的损失函数。
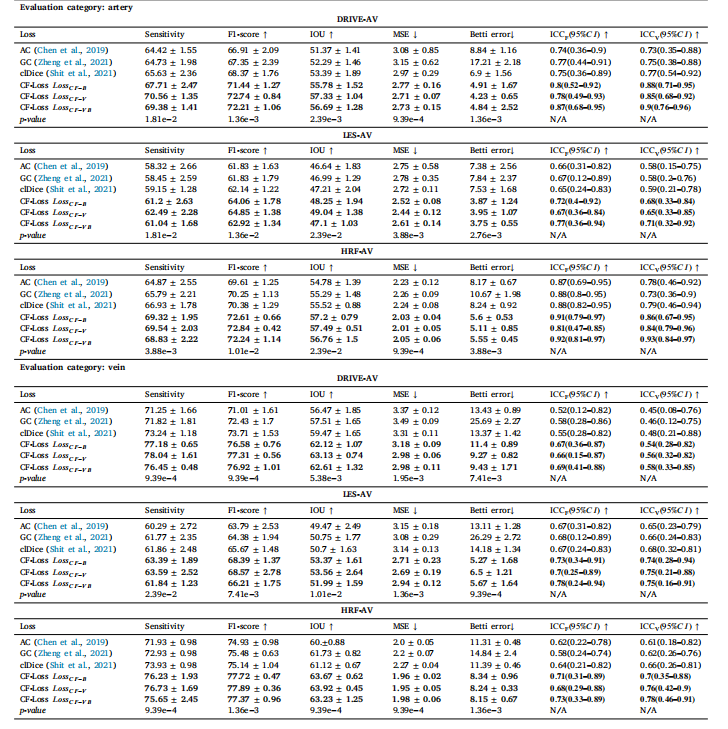
Table 4Artery and vein segmentation performance with U-Net on DRIVE-AV, LES-AV, and HRF-AV.
表4U-Net在DRIVE-AV、LES-AV和HRF-AV数据集上的动脉和静脉分割性能。