python练习-可视化
# 更新pip
python -m pip install --upgrade pip

# 依赖matplotlib
python -m pip install --user matplotlib

pip install pandas
初识画图
import matplotlib.pyplot as plt

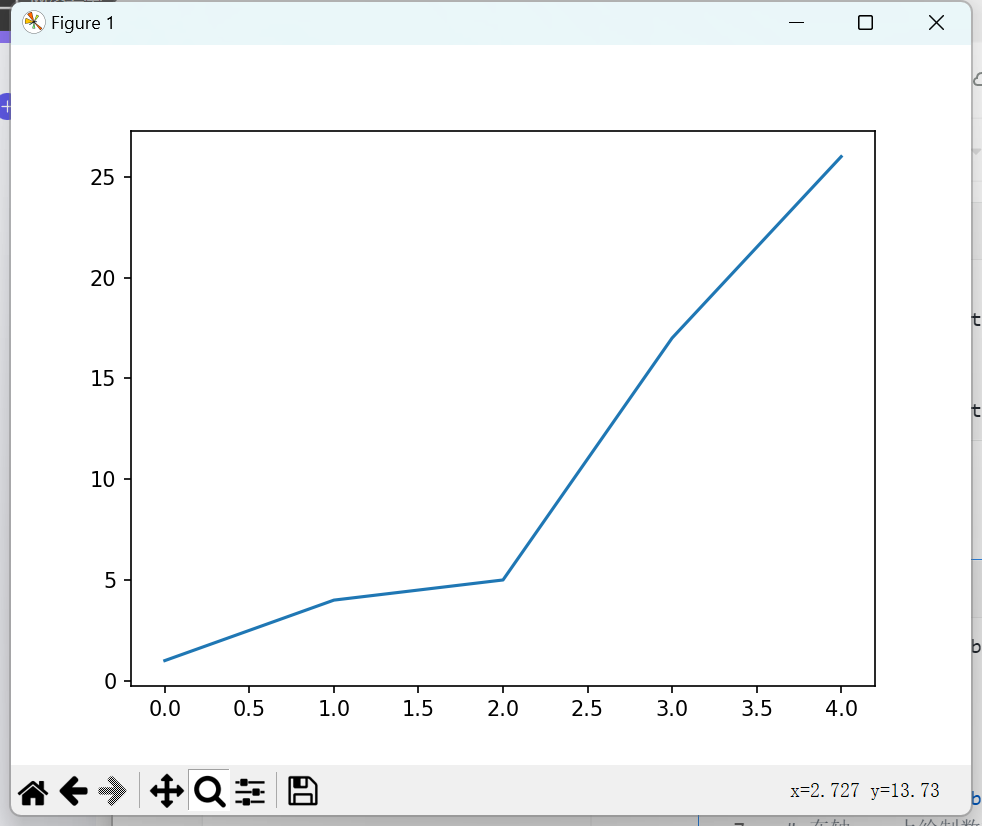
squares = [1, 4, 5, 17, 26]

# plt.subplots() 函数创建一个新的图形(Figure)对象 fig 和一个轴(Axes)对象 ax。
# fig 对象代表整个图形窗口,而 ax 对象代表图形中的一个区域,可以在该区域内绘制数据
fig, ax = plt.subplots()
# 在轴 ax 上绘制数据
# squares 列表中的值将作为 y 轴的值,而 x 轴的值默认是从 0 开始的索引值
ax.plot(squares)
# 绘制的图表
plt.show()
- 修改标签文字和线条粗细
# 设置标题
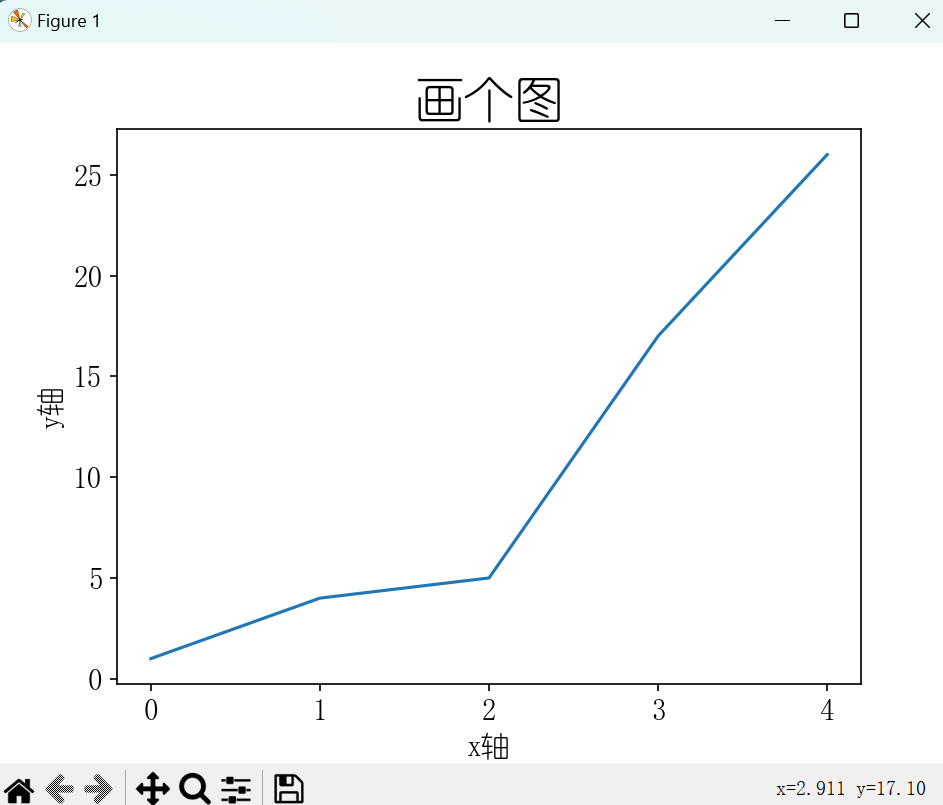
ax.set_title("画个图", fontsize=24)
# 设置 x 轴标签
ax.set_xlabel("x轴", fontsize=14)
# 设置 y 轴标签
ax.set_ylabel("y轴", fontsize=14)
# 设置刻度参数   用于配置轴上的刻度标记和标签
# 参数 axis="both" 表示同时设置 x 轴和 y 轴的刻度参数,labelsize=14 设置了刻度标签(也就是轴上数值)的字体大小为 14
ax.tick_params(axis="both", labelsize=14)
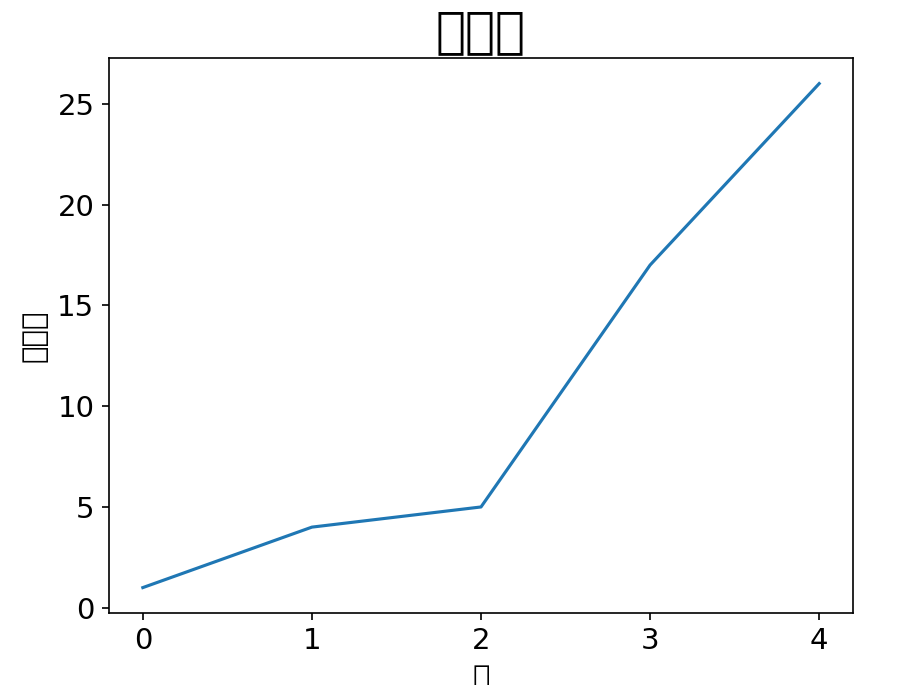
问题:没有中文字体
import matplotlib
matplotlib.rc("font",family='YouYuan')
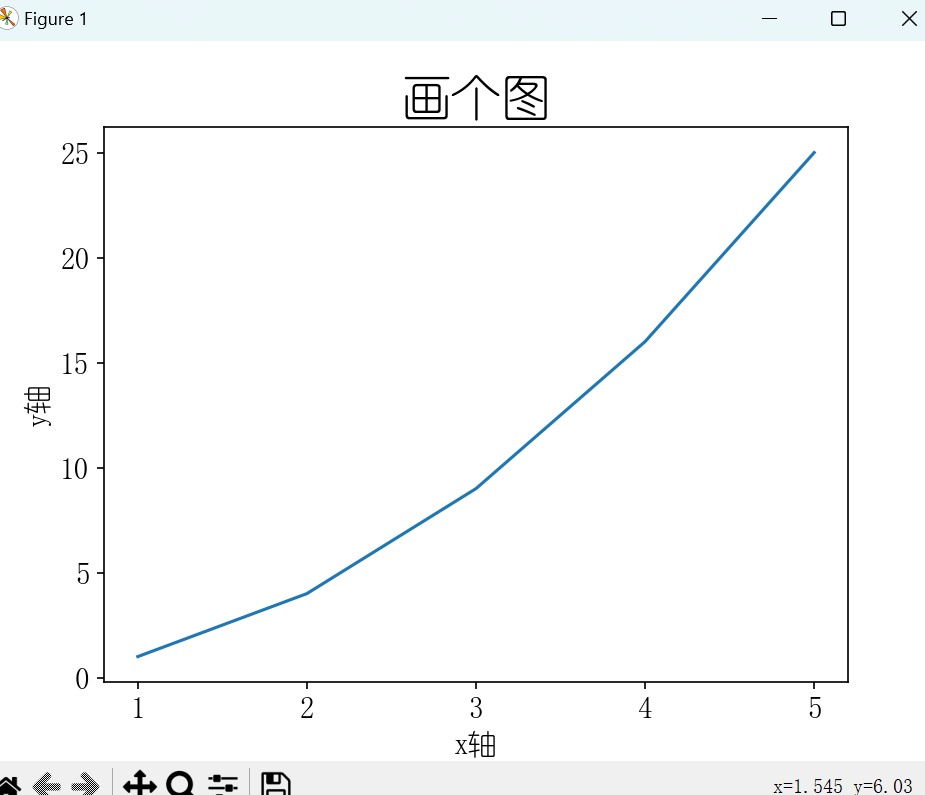
- 校正(明确 xy轴数值)
squares = [1, 4, 9, 16, 25]
val = [1, 2, 3, 4, 5]

# plt.subplots() 函数创建一个新的图形(Figure)对象 fig 和一个轴(Axes)对象 ax。fig 对象代表整个图形窗口,而 ax 对象代表图形中的一个区域,可以在该区域内绘制数据
fig, ax = plt.subplots()
# 在轴 ax 上绘制数据
# squares 列表中的值将作为 y 轴的值,而 x 轴的值默认是从 0 开始的索引值
ax.plot(val, squares)
- 内置样式
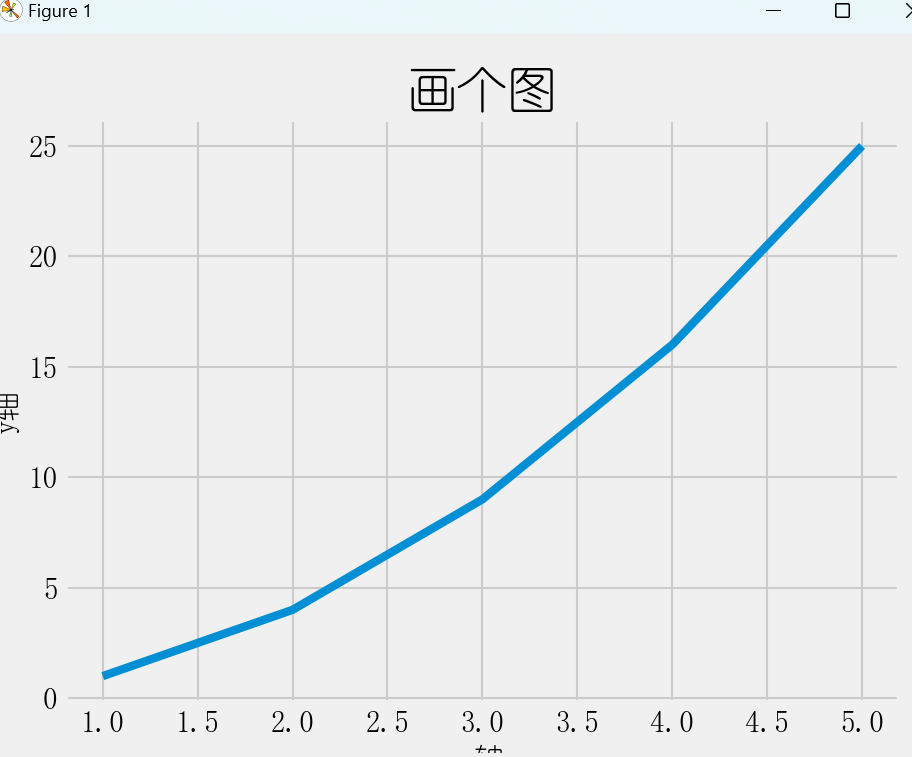
背景色、网格线、线条粗细、字体、字号等
plt.style.available
['Solarize_Light2', '_classic_test_patch', '_mpl-gallery', '_mpl-gallery-nogrid', 'bmh', 'classic', 'dark_background', 'fast', 'fivethirtyeight', 'ggplot', 'grayscale', 'seaborn-v0_8', 'seaborn-v0_8-bright', 'seaborn-v0_8-colorblind', 'seaborn-v0_8-dark', 'seaborn-v0_8-dark-palette', 'seaborn-v0_8-darkgrid', 'seaborn-v0_8-deep', 'seaborn-v0_8-muted', 'seaborn-v0_8-notebook', 'seaborn-v0_8-paper', 'seaborn-v0_8-pastel', 'seaborn-v0_8-poster', 'seaborn-v0_8-talk', 'seaborn-v0_8-ticks', 'seaborn-v0_8-white', 'seaborn-v0_8-whitegrid', 'tableau-colorblind10']
plt.style.use("fivethirtyeight")
matplotlib.rc("font", family="YouYuan")
# 如果使用plt.style.use,matplotlib.rc会被覆盖,在样式里面设置字体或者matplotlib.rc放后面
- 散列图
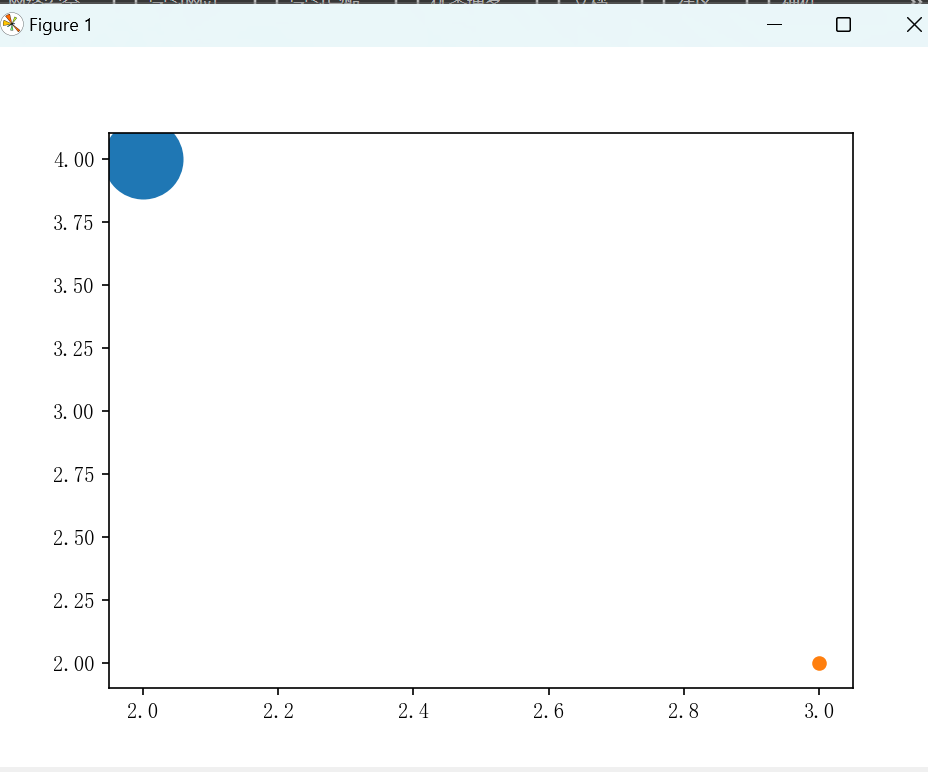
import matplotlib.pyplot as plt

ax.scatter(2,4,s=1400)
ax.scatter(3,2)


# 绘制的图表
plt.show()
import matplotlib.pyplot as plt
import matplotlib

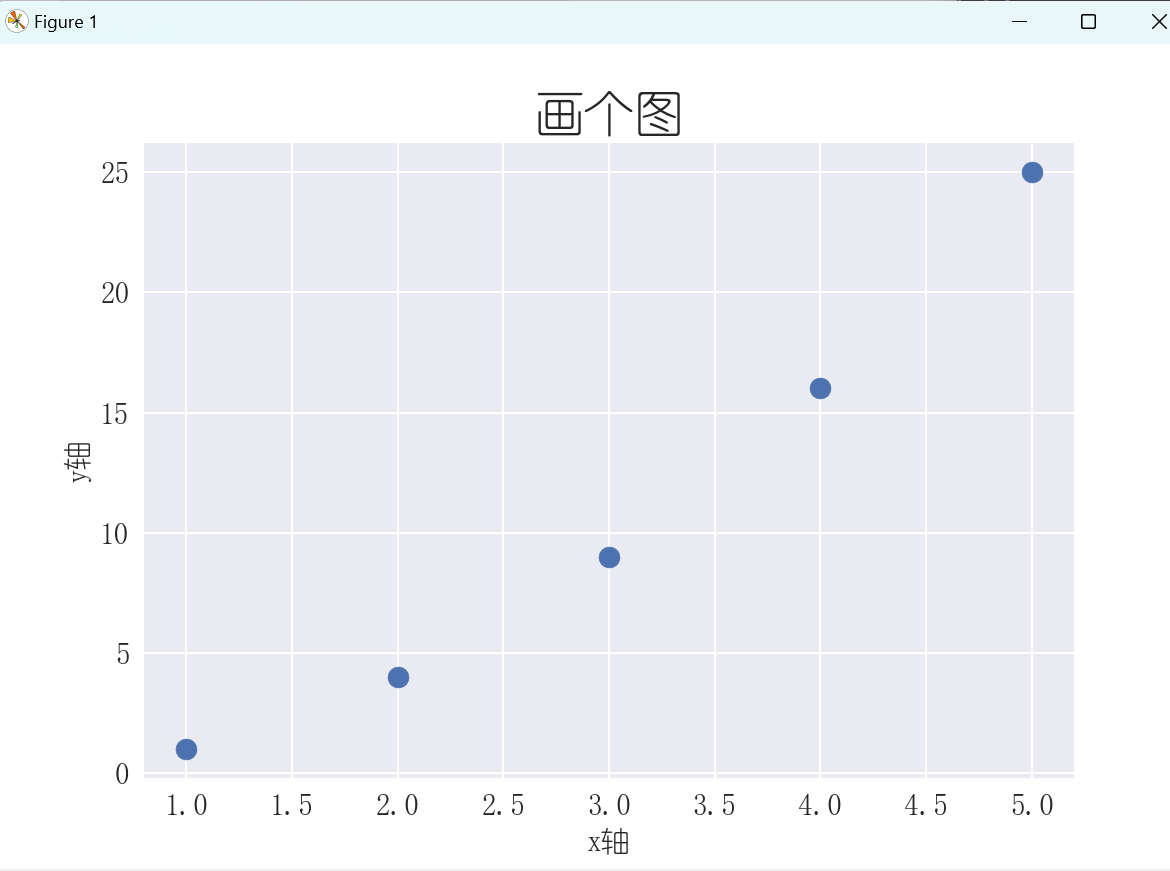
plt.style.use("seaborn")
matplotlib.rc("font", family="YouYuan")

squares = [1, 4, 9, 16, 25]
val = [1, 2, 3, 4, 5]

fig, ax = plt.subplots()

ax.set_title("画个图", fontsize=24)
ax.set_xlabel("x轴", fontsize=14)
ax.set_ylabel("y轴", fontsize=14)
ax.tick_params(axis="both", labelsize=14)

ax.scatter(val,squares,s=100)

plt.show()
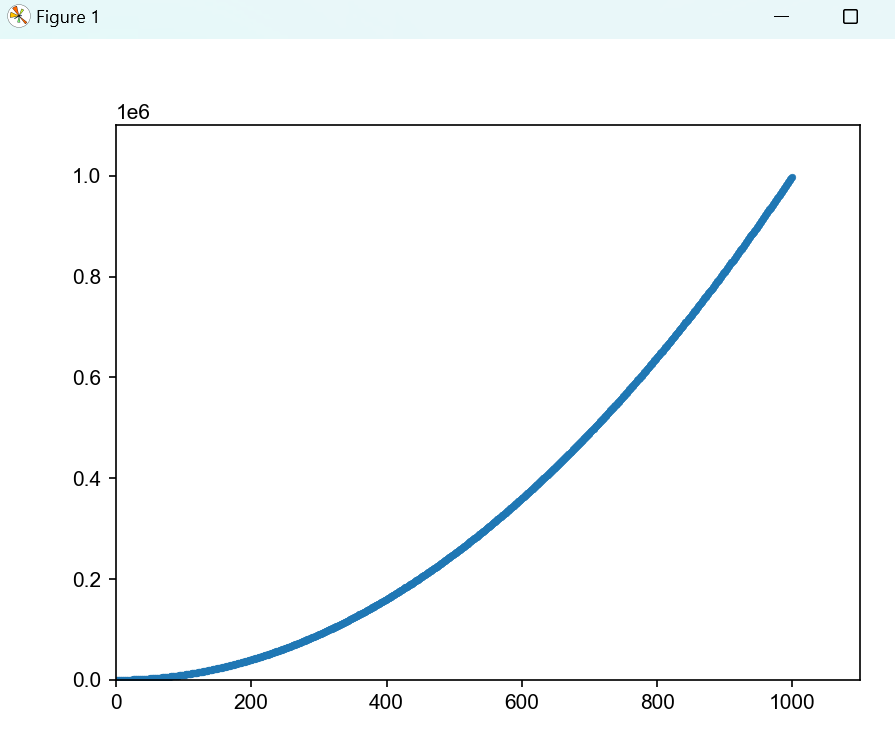
- 自动计算画图
import matplotlib.pyplot as plt


fig, ax = plt.subplots()
x_val = range(1, 1000)
# 求幂
y_val = [x ** 2 for x in x_val]

plt.style.use("seaborn")
ax.scatter(x_val, y_val, s=10)

# 为坐标都设置取值范围
ax.axis([0,1100,0,1100000])

plt.show()
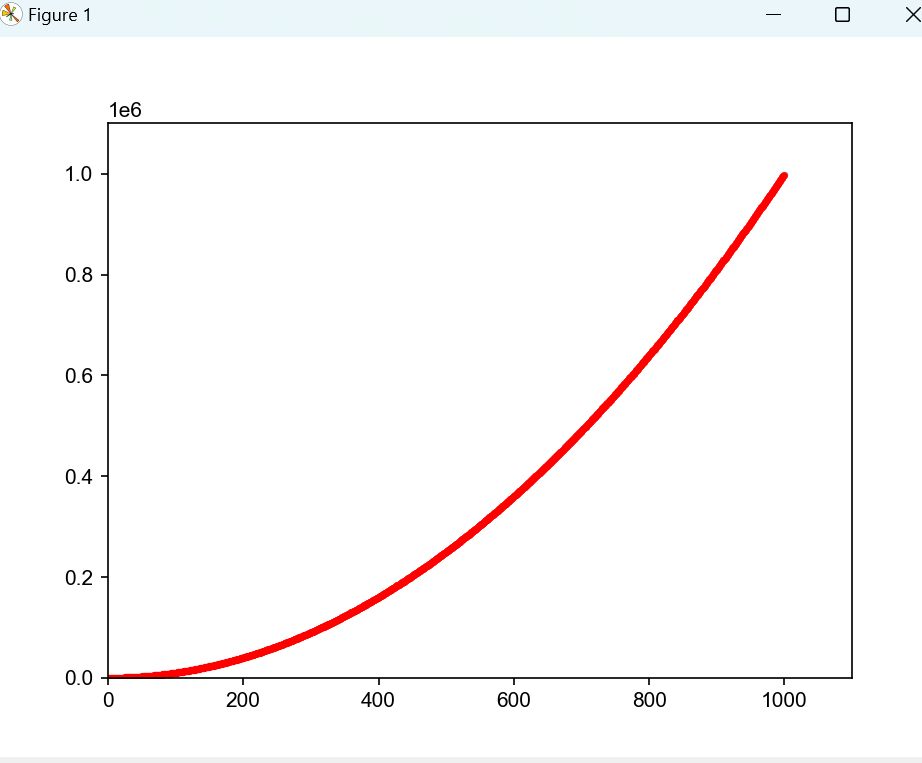
- 自定义颜色
ax.scatter(x_val, y_val, s=10, c="red")
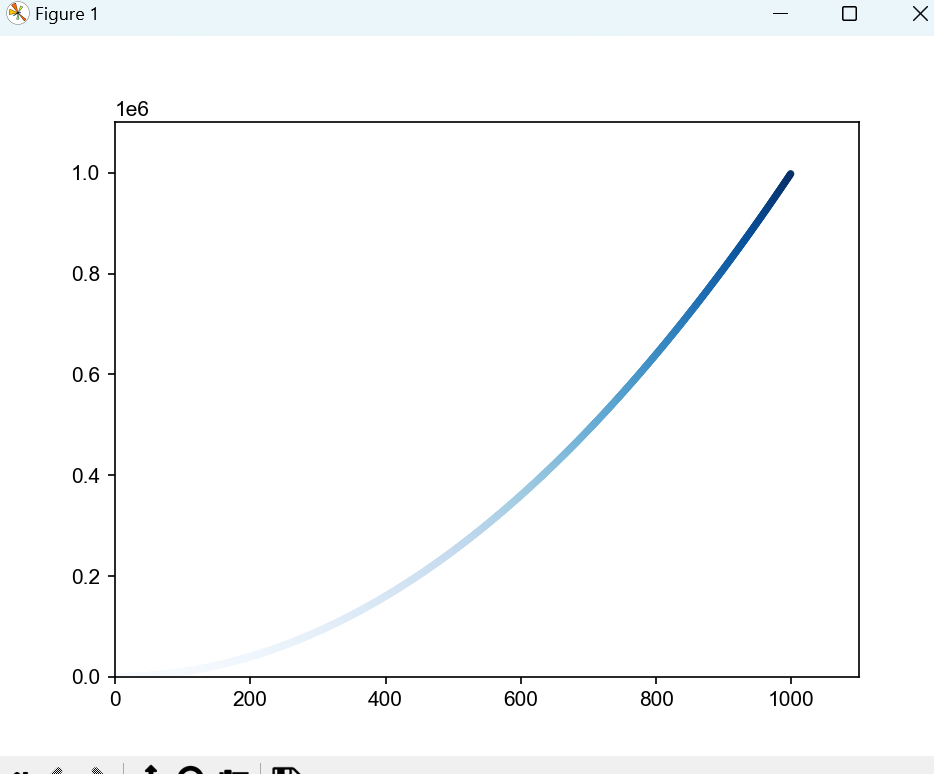
- 颜色映射
# c设置成了一个y值列表,并使用参数cmap告诉pyplot使用哪个颜色映射。这些代码将[插图]值较小的点显示为浅蓝色,并将y值较大的点显示为深蓝色

ax.scatter(x_val, y_val, c=y_val, s=10, cmap=plt.cm.Blues)
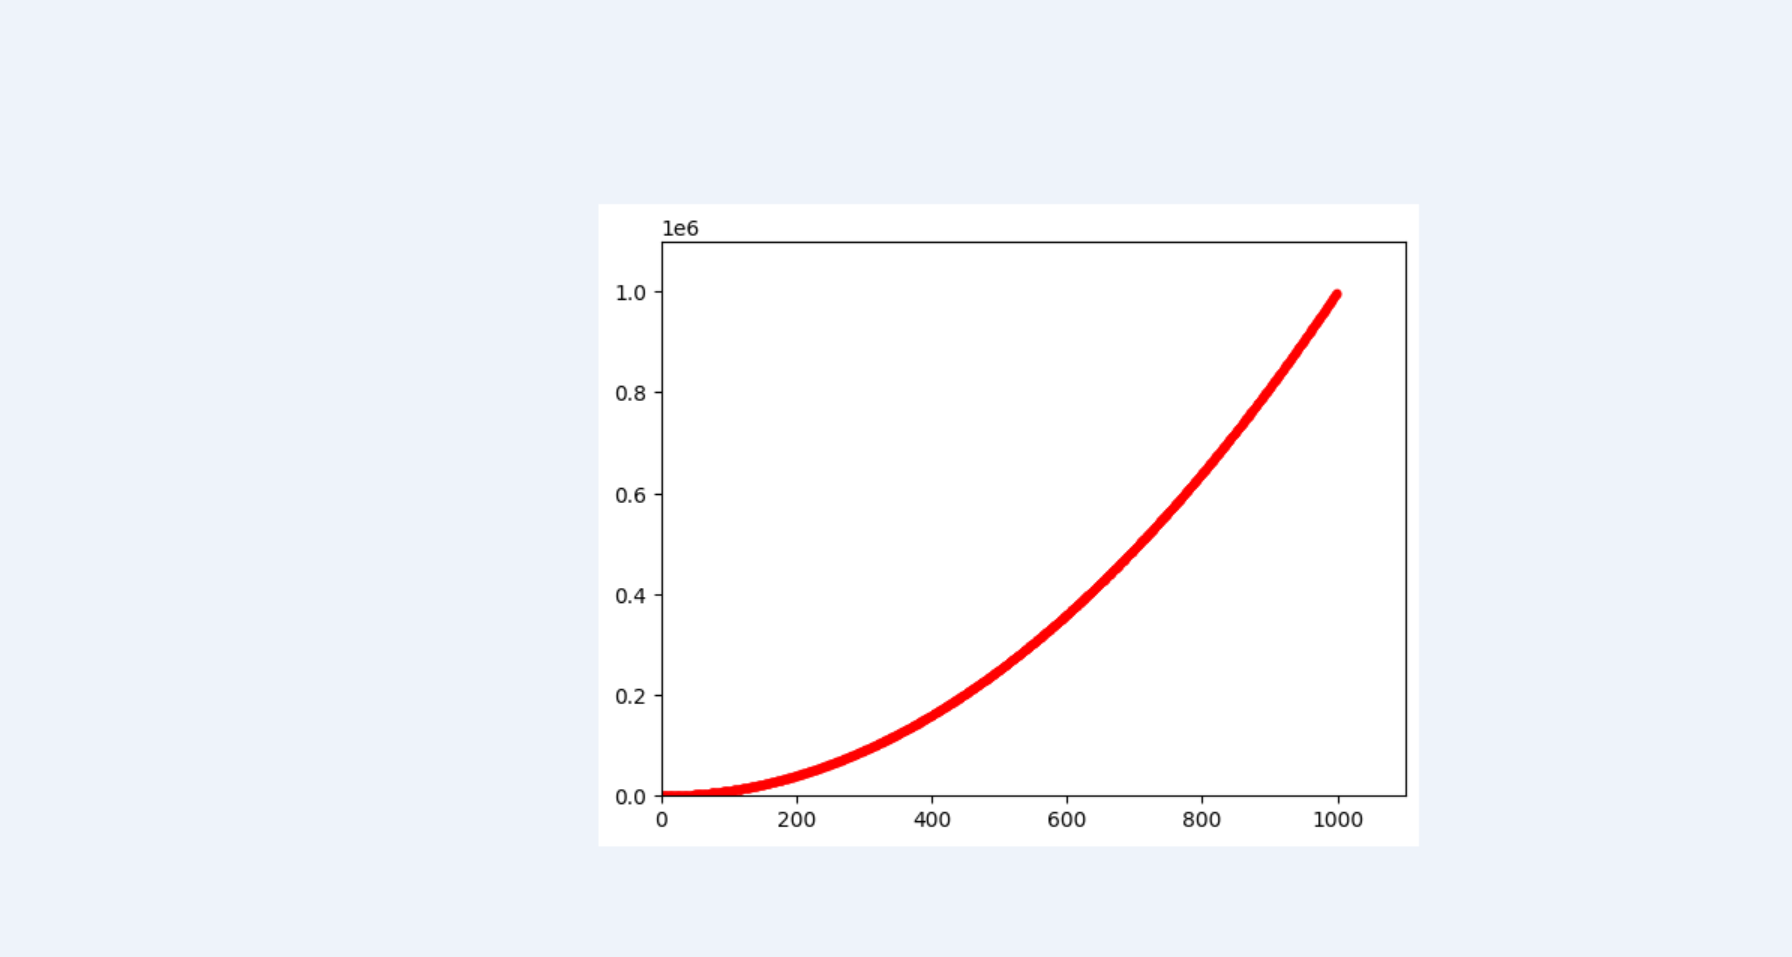
- 自动保存图表
plt.show()替换为调用plt.savefig(),保存的位置为当前运行位置
# plt.show()
plt.savefig("x_val.png", bbox_inches="tight")

# 这个文件将存储到scatter_squares.py所在的目录。第二个实参指定将图表多余的空白区域裁剪掉。如果要保留图表周围多余的空白区域,只需省略这个实参即可
plt.savefig(fname, dpi=None, facecolor=None, edgecolor=None, orientation=None, papertype=None, format=None, transparent=False, bbox_inches=None, pad_inches=0.1, metadata=None)

主要参数解释
    fname:
    类型:字符串或文件对象
    描述:指定保存的文件名或文件对象。可以是相对路径或绝对路径。
    示例:"x_val.png","output/image.pdf"
    dpi:
    类型:int 或 None
    描述:指定保存图像的分辨率(每英寸点数)。默认情况下,Matplotlib 使用图形的 DPI 设置。
    示例:dpi=300
    facecolor:
    类型:颜色或 None
    描述:指定保存图像的背景颜色。默认情况下,使用图形的背景颜色。
    示例:facecolor='white'
    edgecolor:
    类型:颜色或 None
    描述:指定保存图像的边框颜色。默认情况下,使用图形的边框颜色。
    示例:edgecolor='black'
    orientation:
    类型:{'portrait', 'landscape'} 或 None
    描述:指定保存图像的方向。仅适用于 PostScript 和 PDF 文件。
    示例:orientation='landscape'
    papertype:
    类型:字符串或 None
    描述:指定纸张类型。仅适用于 PostScript 和 PDF 文件。
    示例:papertype='a4'
    format:
    类型:字符串或 None
    描述:指定保存文件的格式。如果 fname 中没有指定格式,则使用此参数。支持的格式包括 png, pdf, ps, eps, svg 等。
    示例:format='pdf'
    transparent:
    类型:bool
    描述:指定背景是否透明。默认情况下,背景不透明。
    示例:transparent=True
    bbox_inches:
    类型:'tight' 或 Bbox 或 None
    描述:控制保存的图像边界。如果设置为 'tight',则自动调整边界以去除多余的空白区域。
    示例:bbox_inches='tight'
    pad_inches:
    类型:float
    描述:在 bbox_inches='tight' 时,指定在边界外添加的额外填充(单位为英寸)。
    示例:pad_inches=0.1
    metadata:
    类型:dict 或 None
    描述:指定保存文件的元数据。仅适用于某些格式(如 PDF)。
    示例:metadata={'Title': 'My Plot', 'Author': 'John Doe'}
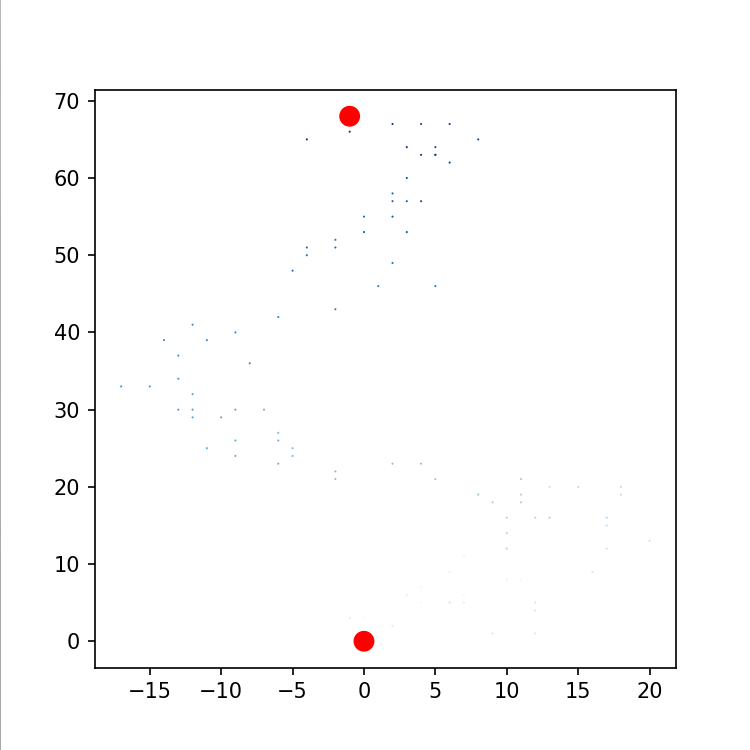
随机漫步
- 随机生成坐标并画图
from random import choice
import matplotlib.pyplot as plt


class RandomWalk:
    def __init__(self, num_points=10):
        self.num_points = num_points

        # 从(0,0)开始
        self.x_val = [0]
        self.y_val = [0]

    def fill_walk(self):

        while len(self.x_val) < self.num_points:

            # 在 1 -1 中随机选
            x_dn = choice([1, -1])
            x_de = choice([0, 1, 2, 3, 4])

            x_s = x_dn * x_de

            y_dn = choice([1, -1])
            y_de = choice([0, 1, 2, 3, 4])

            y_s = y_dn * y_de

            if x_s == 0 and y_s == 0:
                continue

            # 我理解,上一次的数值+这次数值
            x = self.x_val[-1] + x_s
            y = self.y_val[-1] + y_s

            self.x_val.append(x)
            self.y_val.append(y)

    def rw(self):
        rw = RandomWalk()
        rw.fill_walk()

        fig, ax = plt.subplots()
        ax.scatter(rw.x_val,rw.y_val,s=15)
        plt.show()


RandomWalk().rw()
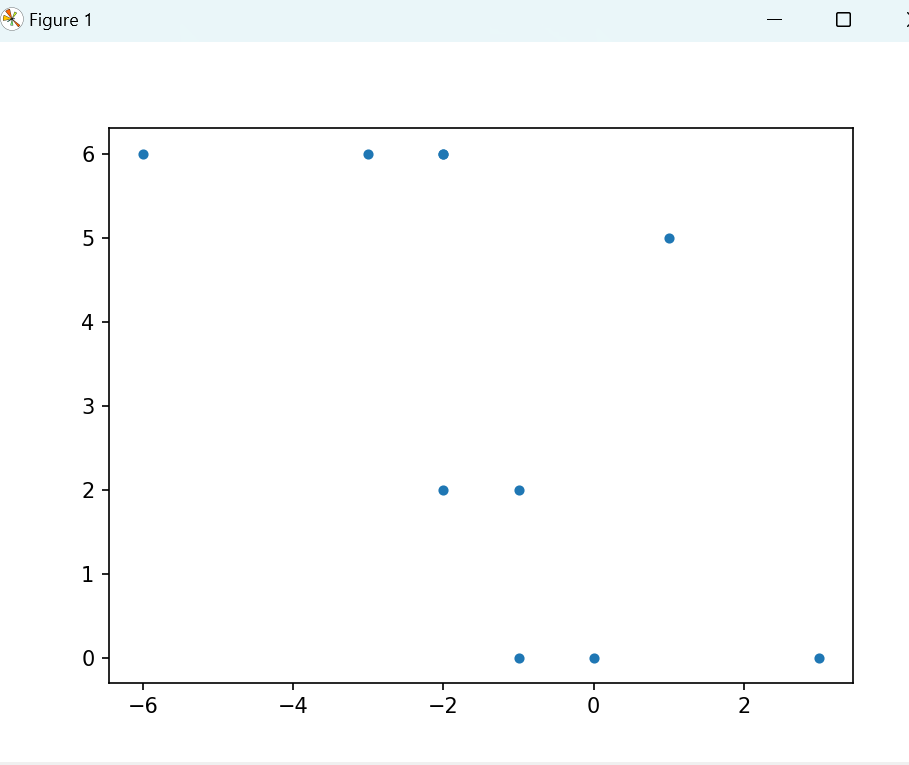
- 设置样式
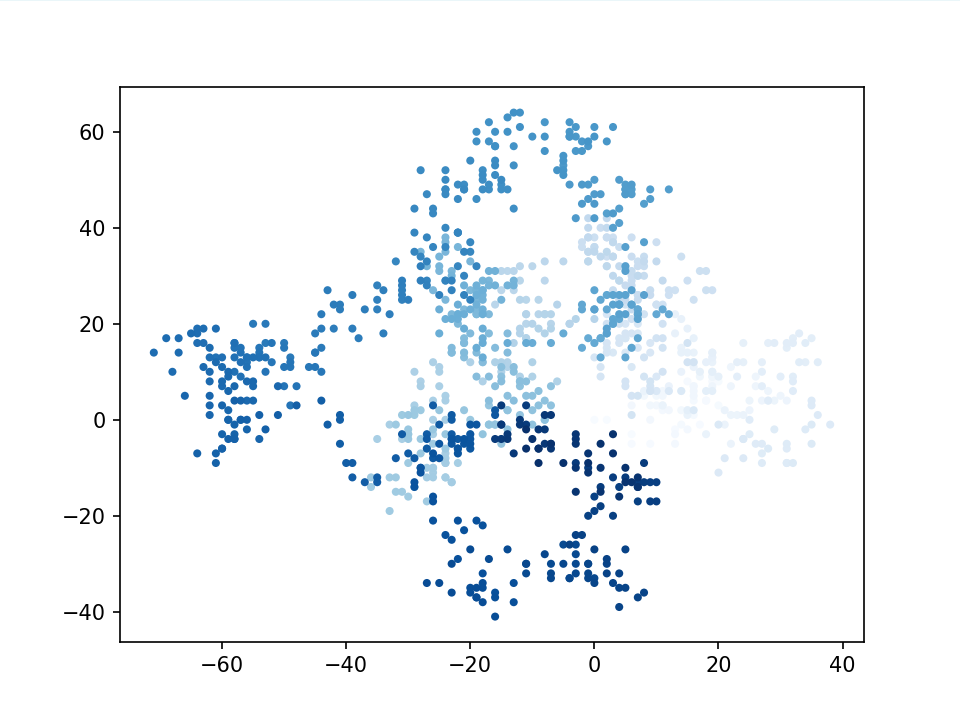
num_points = range(rw.num_points)
# edgecolors="none": 这个参数控制点边缘的颜色。设置为"none"意味着散点图中的点将没有边框
ax.scatter(
    rw.x_val, rw.y_val, c=num_points, cmap=plt.cm.Blues, edgecolors="none", s=15
)
ax.scatter理解:
# c:映射到那个点
# edgecolors="none": 这个参数控制点边缘的颜色。设置为"none"意味着散点图中的点将没有边框
ax.scatter(
            [1,2,3,4,5,6], [1,2,3,4,5,6], c=[6,5,4,3,2,1], cmap=plt.cm.Blues, edgecolors="none", s=15
        )

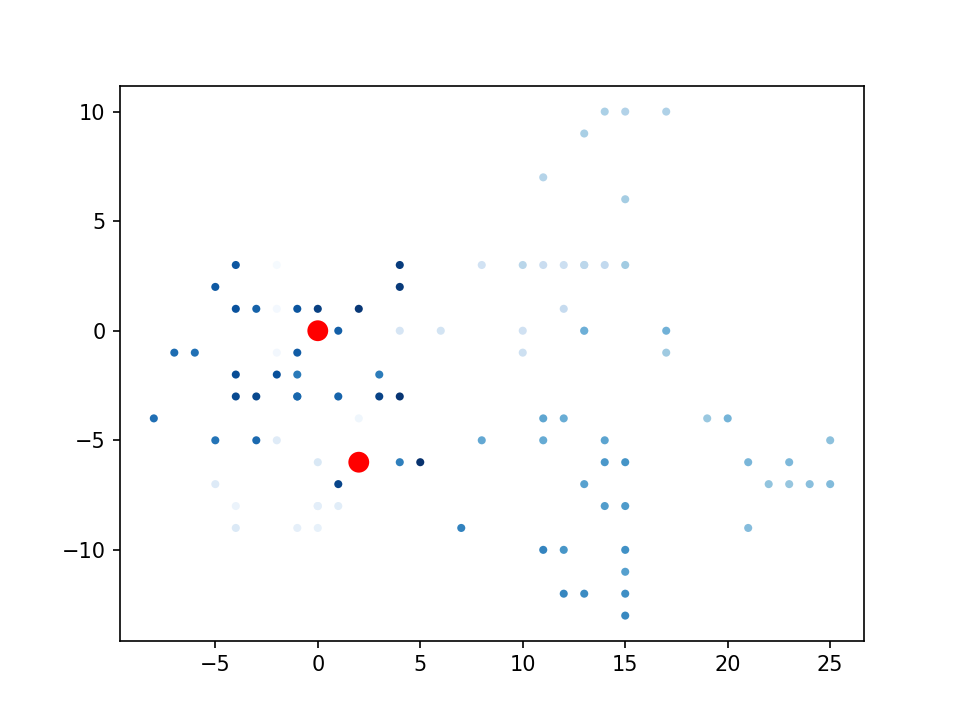
突出点着色
ax.scatter(0, 0, c="red", edgecolors="none", s=100)
ax.scatter(rw.x_val[-1], rw.y_val[-1], c="red", edgecolors="none", s=100)
隐藏坐标轴
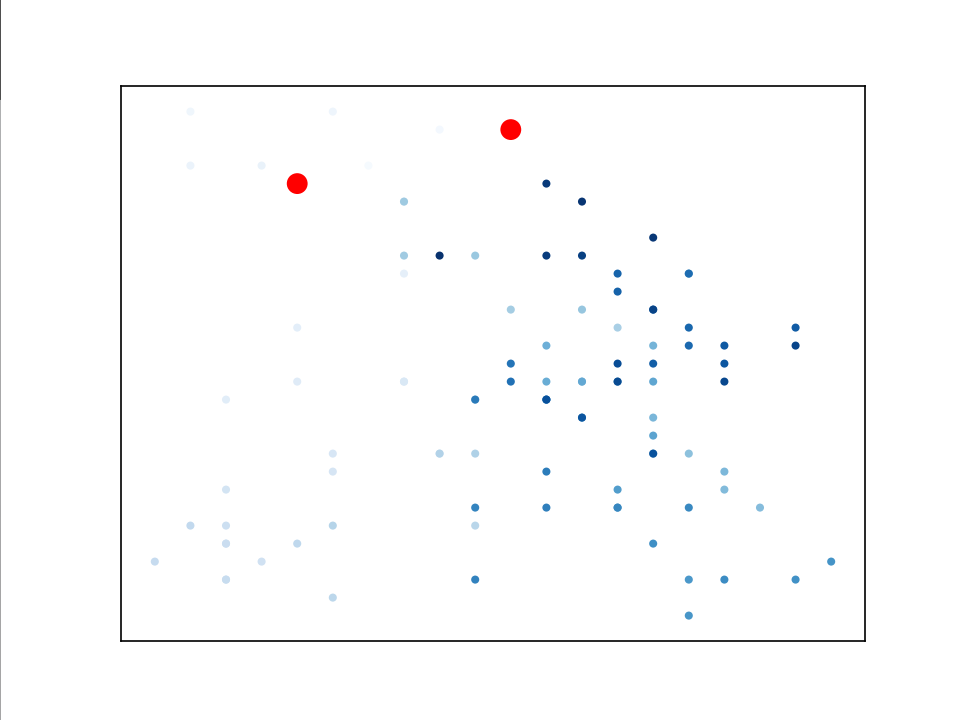
# 隐藏坐标轴
ax.get_xaxis().set_visible(False)
ax.get_yaxis().set_visible(False)
调整屏幕尺寸
fig, ax = plt.subplots(figsize=(5, 5))
- 模拟掷骰子
定义6面骰子
from random import randint


class Die:

    def __init__(self, num_sides=6):
        # 骰子默认为6面
        self.num_sides = num_sides

    def roll(self):
        # 返回一个位于1和骰子面数之间的随机值
        return randint(1, self.num_sides)
统计骰子出现次数
class Die_Visual:
    def run(self):
        die = Die()
        res = []
        for num in range(10):
            res.append(die.roll())

        # f_res = [0, 0, 0, 0, 0, 0, 0]
        # for r in res:
        #     f_res[r] += 1

        # print(res)
        # print(f_res)
        # # [3, 6, 6, 3, 6, 1, 2, 2, 1, 6]
        # # [0, 2, 2, 2, 0, 0, 4]

        f_res = []
        # 1-6,1开始统计在res出现的次数,依次存入数组
        for r in range(1, die.num_sides + 1):
            f_res.append(res.count(r))

        print(res)
        print(f_res)
        # [6, 2, 4, 2, 4, 3, 2, 5, 5, 1]
        # [1, 3, 1, 2, 2, 1]
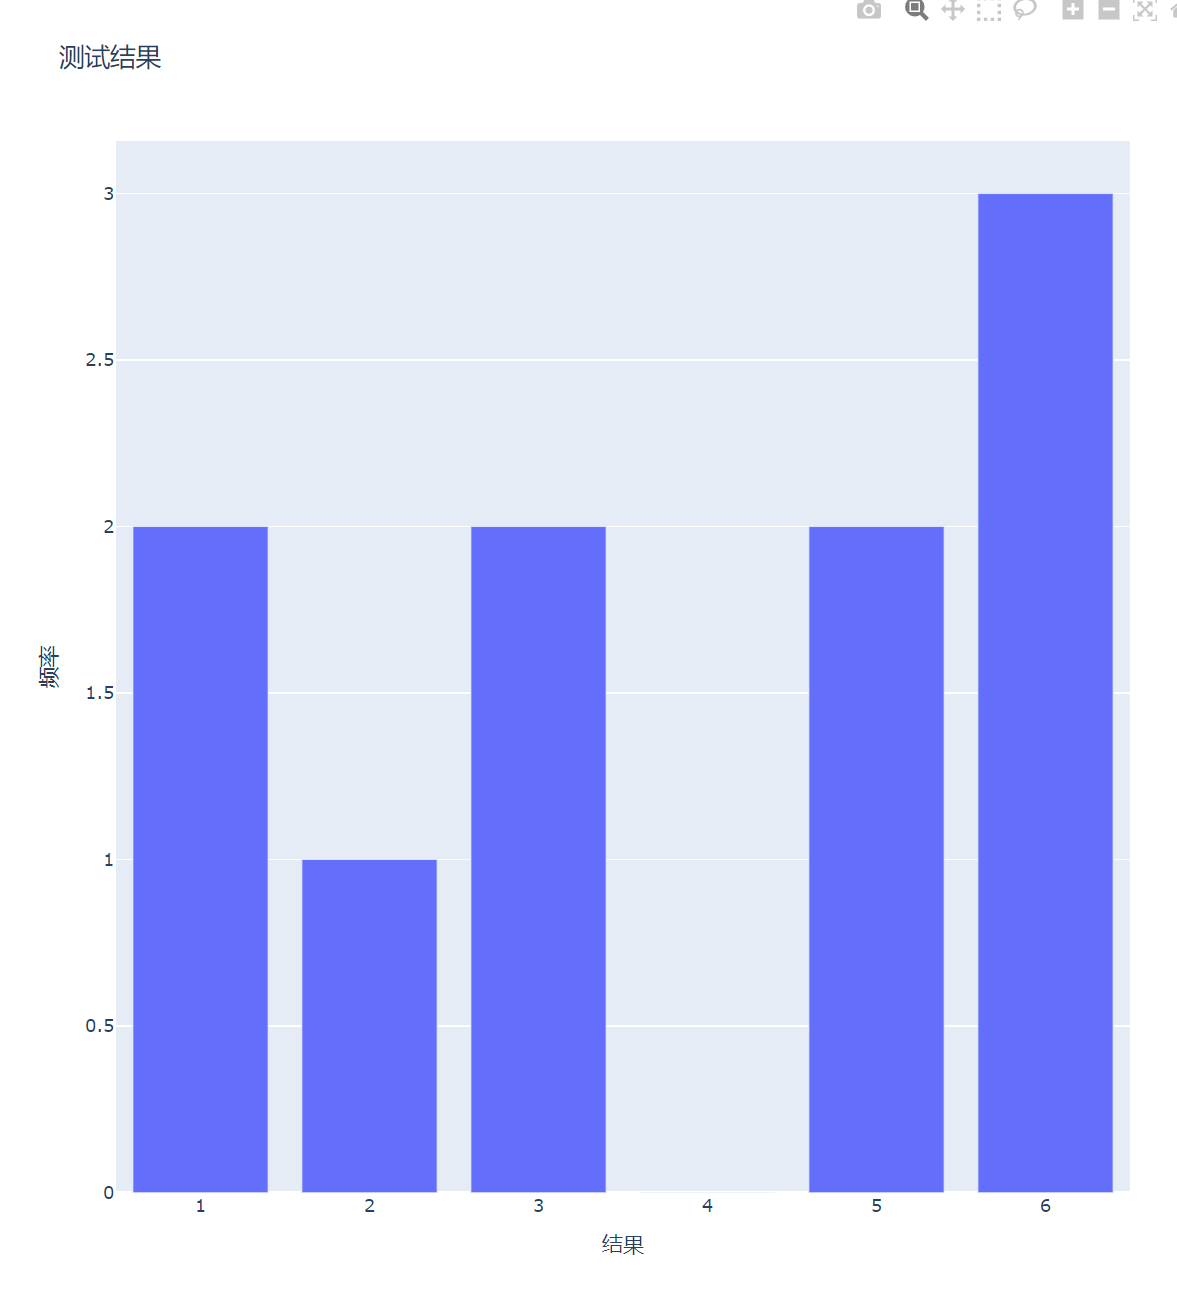
绘制直方图
from random import randint
from plotly import offline
from plotly.graph_objs import Bar,Layout


class Die:

    def __init__(self, num_sides=6):
        # 骰子默认为6面
        self.num_sides = num_sides

    def roll(self):
        # 返回一个位于1和骰子面数之间的随机值
        return randint(1, self.num_sides)


class Die_Visual:
    def run(self):
        self.show()

    def data_val(self):
        die = Die()
        res = []
        for num in range(10):
            res.append(die.roll())

        f_res = []
        # 1-6,1开始统计在res出现的次数,依次存入数组
        for r in range(1, die.num_sides + 1):
            f_res.append(res.count(r))

        print(res)
        print(f_res)
        # [6, 2, 4, 2, 4, 3, 2, 5, 5, 1]
        # [1, 3, 1, 2, 2, 1]

        return f_res

    def show(self):
        # 拿到统计数据
        data_val = self.data_val()
        # 设置x轴数值 1 2 3 4 5 6
        x_val = list(range(1, 7))
        # 创建一个 Bar 对象,传入 x 轴和 y 轴的数据。
        # go.Bar 是 plotly.graph_objs 中的一个类,用于创建条形图。
        data = [Bar(x=x_val, y=data_val)]

        x_axis_config = {"title": "结果"}
        y_axis_config = {"title": "频率"}
        my_lay = Layout(title="测试结果", xaxis=x_axis_config, yaxis=y_axis_config)

        # 使用 plotly.offline.plot 方法生成图表,并将其保存为 d6.html 文件
        # offline.plot({"data": data, "layout": my_lay}, filename="d6.html")
        offline.plot({"data": data, "layout": my_lay})


Die_Visual().show()

# [2, 6, 3, 3, 5, 5, 6, 6, 1, 1]
# [2, 1, 2, 0, 2, 3]
下载数据
- CSV文件格式
CSV文件的基本结构
字段分隔符:通常使用逗号 , 作为字段分隔符。
行分隔符:通常使用换行符 \n 或回车换行符 \r\n 作为行分隔符。
字段值:字段值可以是数字、字符串或其他数据类型。如果字段值中包含逗号、双引号或换行符,通常需要用双引号 " 将整个字段值包围起来。
转义字符:如果字段值中包含双引号,通常需要使用两个双引号 “” 来表示一个双引号。

Name,Age,City
Alice,24,New York
Bob,30,"Los Angeles, CA"
Carol,28,Chicago
- 读取文件
文件第一行

import csv


class Sitka:
    filename = "C:/Users/MGL/Desktop/py_test/Matplotlib/test.csv"

    def file_open(self):
        with open(self.filename) as f:
            reader = csv.reader(f)
            header_row = next(reader)
            # ['STATION', 'NAME', 'DATE', 'PRCP', 'TAVG', 'TMAX', 'TMIN']
            print(header_row)

Sitka().file_open()
打印文件头及其位置
def file_open(self):
        with open(self.filename) as f:
            reader = csv.reader(f)
            header_row = next(reader)
            for index, column in enumerate(header_row):
                print(index, column)
                # 0 STATION
                # 1 NAME
                # 2 DATE
                # 3 PRCP
                # 4 TAVG
                # 5 TMAX
                # 6 TMIN
enumerate 函数:
enumerate 函数用于将一个可迭代对象(如列表、元组等)组合为一个索引序列,同时列出数据和数据下标。
语法:enumerate(iterable, start=0),其中 iterable 是要遍历的可迭代对象,start 是索引的起始值,默认为0。
with open(self.filename) as f:
    reader = csv.reader(f)

    highs = []
    for row in reader:
        # 获取TMAX列的数据
        high = int(row[5])
        highs.append(high)
print(highs)
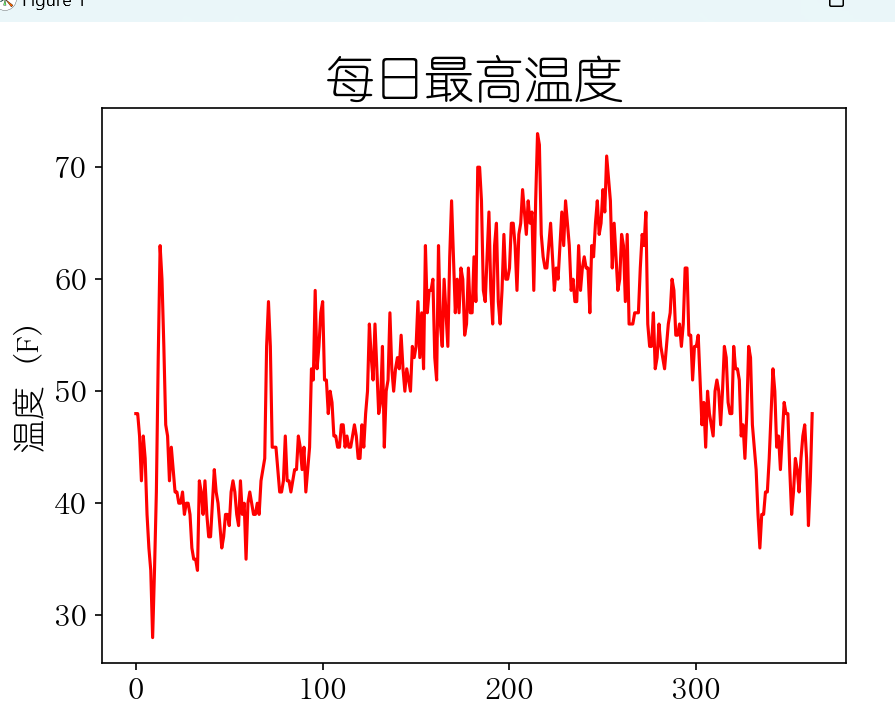
绘制温度图表
def show(self):
    # 根据最高温度绘制图形
    # plt.style.use("seaborn")
    fig, ax = plt.subplots()
    ax.plot(self.file_open(), c="red")

    # 设置图形的格式
    ax.set_title('每日最高温度', fontsize=24)
    ax.set_xlabel("", fontsize=16)
    ax.set_ylabel('温度 (F)', fontsize=16)
    ax.tick_params(axis="both", which="major", labelsize=16)
    plt.show()
ax.tick_params 方法用于设置坐标轴刻度的外观
ax.tick_params(axis="both", which="major", labelsize=16)

axis:
    类型:字符串
    可选值:"x"、"y" 或 "both"
    描述:指定要设置哪个轴的刻度参数。"both" 表示同时设置 x 轴和 y 轴的刻度参数。
which:
    类型:字符串
    可选值:"major"、"minor" 或 "both"
    描述:指定要设置哪种类型的刻度。"major" 表示只设置主刻度,"minor" 表示只设置次刻度,"both" 表示同时设置主刻度和次刻度。
labelsize:
    类型:整数或浮点数
    描述:设置刻度标签的字体大小。在这个例子中,labelsize=16 表示将刻度标签的字体大小设置为 16。
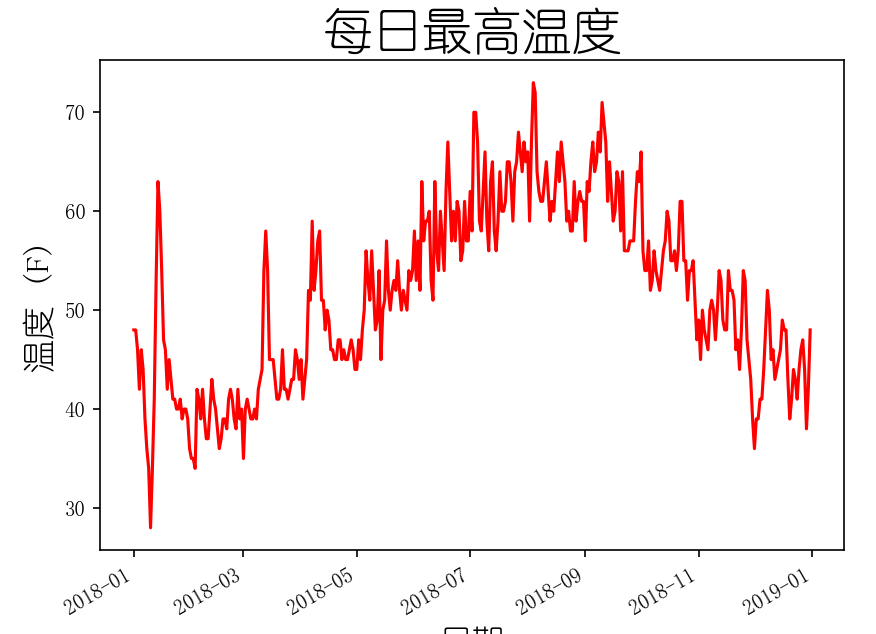
图表中添加日期
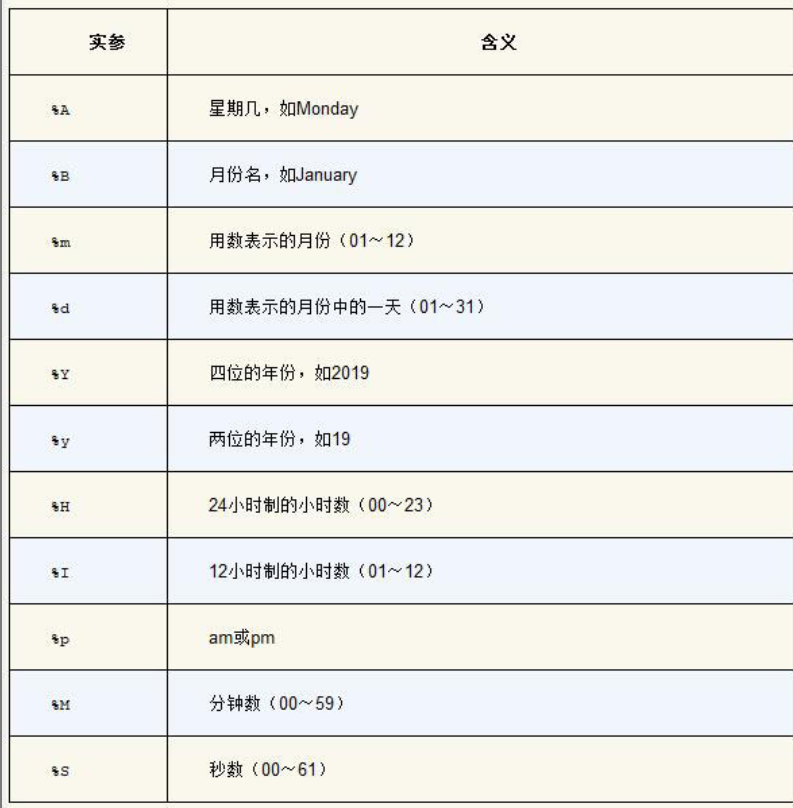
def test(self):
    # 2024-11-10 00:00:00
    print(datetime.strptime('2024-11-10','%Y-%m-%d'))
from datetime import datetime

def file_open(self):
    with open(self.filename) as f:
        reader = csv.reader(f)
        header_row = next(reader)

        datas, highs = [], []
        for row in reader:
            current_date = datetime.strptime(row[2], "%Y-%m-%d")
            datas.append(current_date)
            # 获取TMAX列的数据
            high = int(row[5])
            highs.append(high)
    return datas, highs


def show(self):
    datas, highs = self.file_open()
    # 根据最高温度绘制图形
    # plt.style.use("seaborn")
    fig, ax = plt.subplots()
    # x轴值倾斜
    fig.autofmt_xdate()
    ax.plot(datas, highs, c="red")

    # 设置图形的格式
    ax.set_title("每日最高温度", fontsize=24)
    ax.set_xlabel("日期", fontsize=16)
    ax.set_ylabel("温度 (F)", fontsize=16)
    ax.tick_params(axis="both", which="major", labelsize=10)
    plt.show()
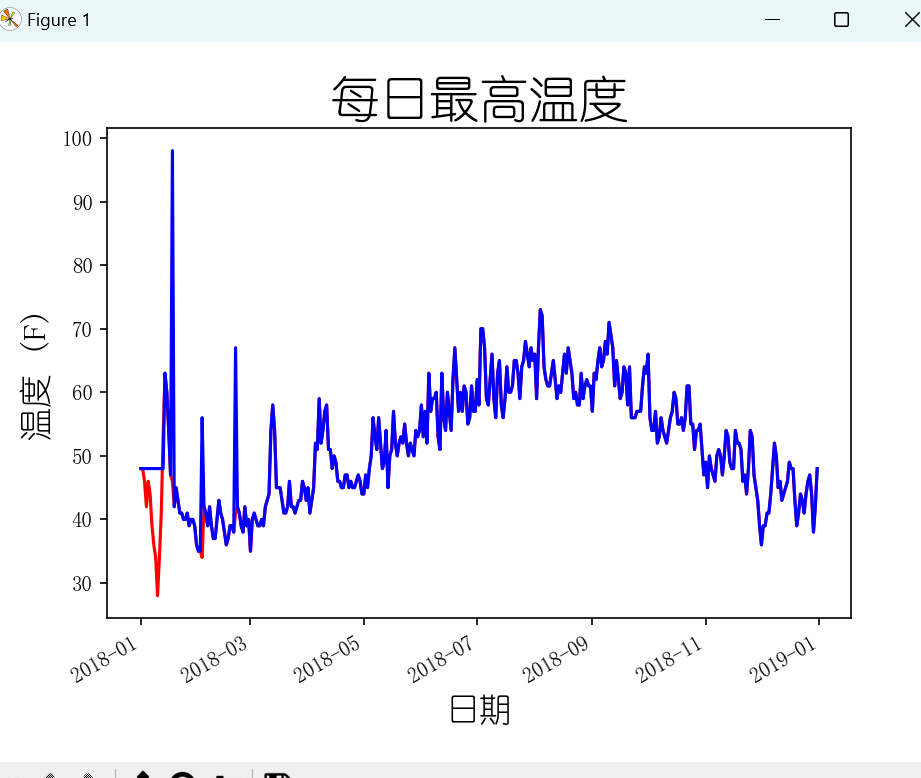
两个文件数据
def file_open(self, filename):
    with open(filename) as f:
        reader = csv.reader(f)
        header_row = next(reader)

        datas, highs = [], []
        for row in reader:
            current_date = datetime.strptime(row[2], "%Y-%m-%d")
            datas.append(current_date)
            # 获取TMAX列的数据
            high = int(row[5])
            highs.append(high)
    return datas, highs


def show(self):
    datas1, highs1 = self.file_open(self.filename1)
    datas2, highs2 = self.file_open(self.filename2)
    # 根据最高温度绘制图形
    # plt.style.use("seaborn")
    fig, ax = plt.subplots()
    fig.autofmt_xdate()
    ax.plot(datas1, highs1, c="red")
    ax.plot(datas2, highs2, c="blue")

    # 设置图形的格式
    ax.set_title("每日最高温度", fontsize=24)
    ax.set_xlabel("日期", fontsize=16)
    ax.set_ylabel("温度 (F)", fontsize=16)
    ax.tick_params(axis="both", which="major", labelsize=10)
    plt.show()
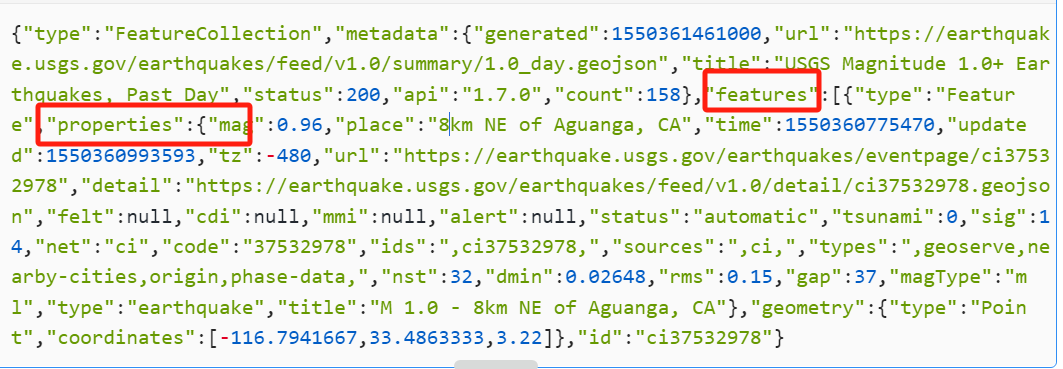
- JSON格式
{"type":"FeatureCollection","metadata":{"generated":1550361461000,"url":"https://earthquake.usgs.gov/earthquakes/feed/v1.0/summary/1.0_day.geojson","title":"USGS Magnitude 1.0+ Earthquakes, Past Day","status":200,"api":"1.7.0","count":158},"features":[{"type":"Feature","properties":{"mag":0.96,"place":"8km NE of Aguanga, CA","time":1550360775470,"updated":1550360993593,"tz":-480,"url":"https://earthquake.usgs.gov/earthquakes/eventpage/ci37532978","detail":"https://earthquake.usgs.gov/earthquakes/feed/v1.0/detail/ci37532978.geojson","felt":null,"cdi":null,"mmi":null,"alert":null,"status":"automatic","tsunami":0,"sig":14,"net":"ci","code":"37532978","ids":",ci37532978,","sources":",ci,","types":",geoserve,nearby-cities,origin,phase-data,","nst":32,"dmin":0.02648,"rms":0.15,"gap":37,"magType":"ml","type":"earthquake","title":"M 1.0 - 8km NE of Aguanga, CA"},"geometry":{"type":"Point","coordinates":[-116.7941667,33.4863333,3.22]},"id":"ci37532978"}
读取数据
def open_json(self, filename):
    with open(filename) as f:
        json_data = json.load(f)

    features_datas = json_data["features"]

    mags = []
    for features in features_datas:
        mag = features["properties"]["mag"]
        mags.append(mag)
绘制散点图
import json
import plotly.express as px

filename_json_1 = "test1.json"


class Eq:

    def open_json(self, filename):
        with open(filename) as f:
            json_data = json.load(f)

        features_datas = json_data["features"]

        mags, titles, lons, lats = [], [], [], []
        for features in features_datas:
            mag = features["properties"]["mag"]
            title = features["properties"]["title"]
            lon = features["geometry"]["coordinates"][0]
            lat = features["geometry"]["coordinates"][1]
            mags.append(mag)
            titles.append(title)
            lons.append(lon)
            lats.append(lat)

        return mags, titles, lons, lats

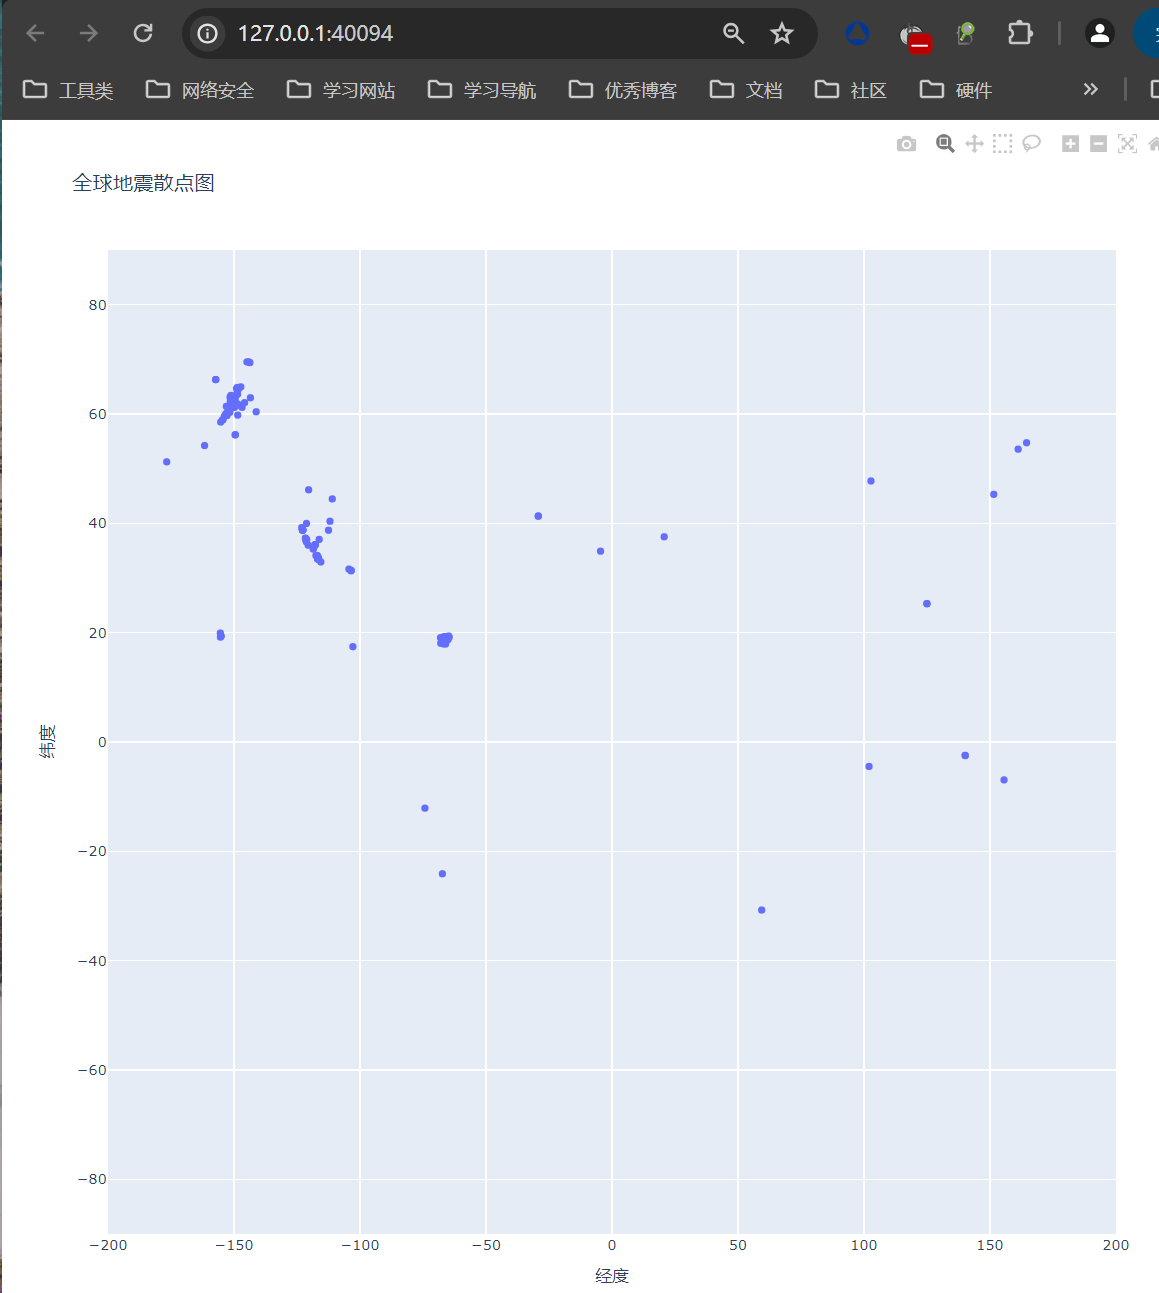
    def show(self):
        mags, titles, lons, lats = self.open_json(filename_json_1)
        fig = px.scatter(
            x=lons,
            y=lats,
            labels={"x": "经度", "y": "纬度"},
            range_x=[-200, 200],
            range_y=[-90, 90],
            width=800,
            height=800,
            title="全球地震散点图",
        )
        fig.write_html("test111.html")
        fig.show()
x=lons: 指定 x 轴的数据为经度。
y=lats: 指定 y 轴的数据为纬度。
labels={"x": "经度", "y": "纬度"}: 设置 x 轴和 y 轴的标签。
range_x=[-200, 200]: 设置 x 轴的范围从 -200 到 200。
range_y=[-90, 90]: 设置 y 轴的范围从 -90 到 90。
width=800, height=800: 设置图表的宽度和高度为 800 像素。
title="全球地震散点图": 设置图表的标题。

fig.write_html("test111.html"): 将生成的图表保存为一个 HTML 文件,文件名为 test111.html。
fig.show(): 在默认浏览器中打开并显示图表。
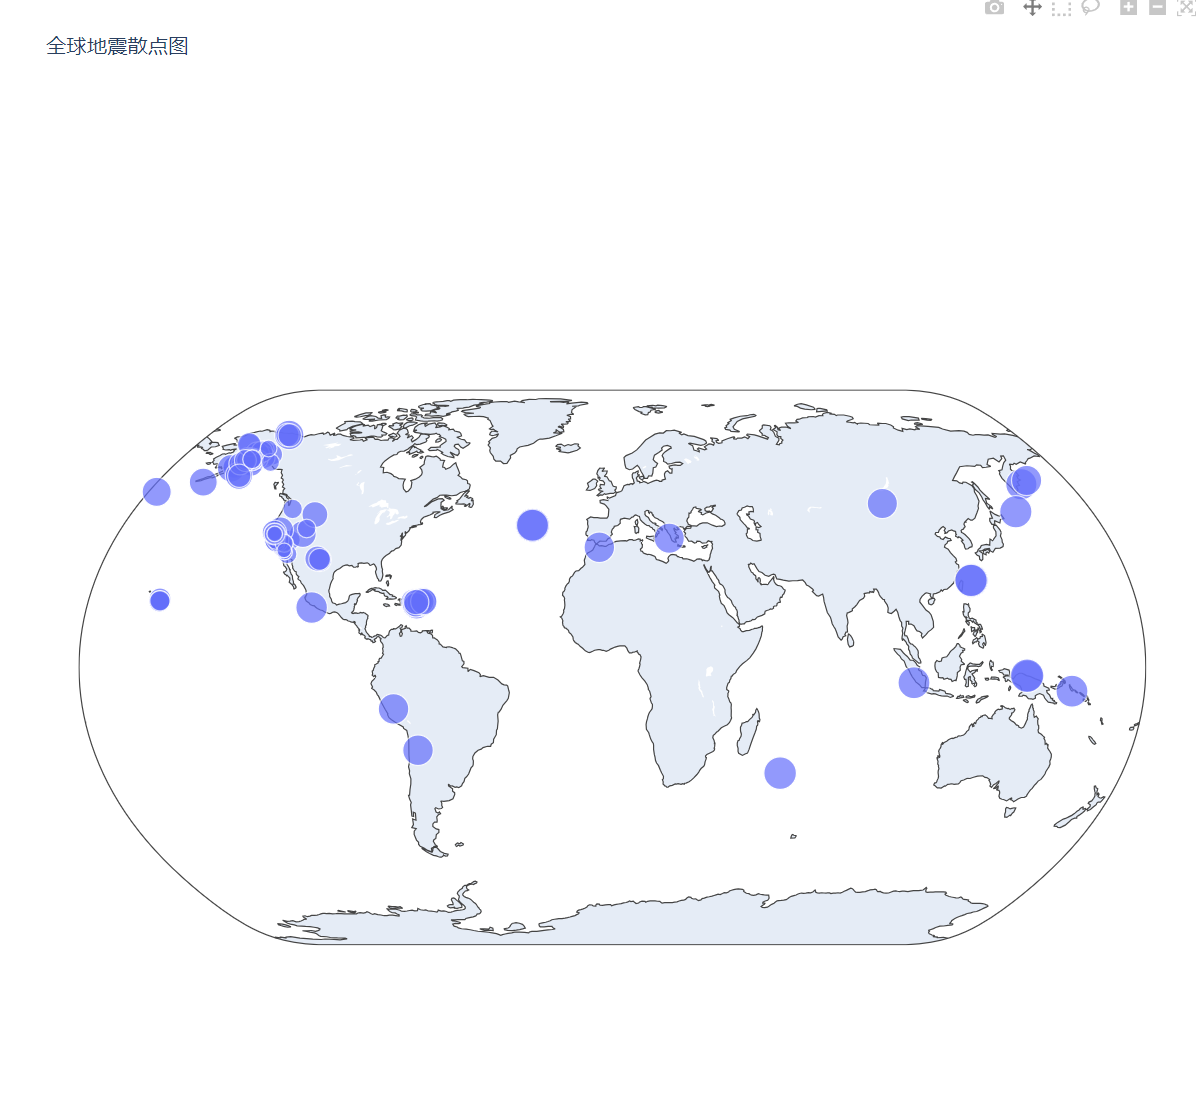
带有地理的散点图
fig = px.scatter_geo(
    lon=lons,
    lat=lats,
    size=mags,
    hover_name=titles,
    projection="natural earth",
    title="全球地震散点图",
)

fig.write_html("test111.html")
fig.show()
# 更新布局
fig.update_layout(
    geo=dict(
        showland=True,  # 显示陆地
        landcolor="rgb(212, 212, 212)",  # 陆地颜色
        subunitcolor="rgb(255, 255, 255)",  # 子单位边界颜色
        countrycolor="rgb(255, 255, 255)",  # 国家边界颜色
        showlakes=True,  # 显示湖泊
        lakecolor="rgb(255, 255, 255)",  # 湖泊颜色
        showocean=True,  # 显示海洋
        oceancolor="rgb(230, 230, 255)"  # 海洋颜色
    ),
    width=1000,
    height=1000
)

另一种散点图表达
def show1(self):
    mags, titles, lons, lats = self.open_json(filename_json_1)
    data = pd.DataFrame(
        zip(lons, lats, titles, mags), columns=["经度", "纬度", "位置", "震级"]
    )
    data.head()

    fig = px.scatter(
        data,
        x="经度",
        y="纬度",
        range_x=[-200,200],
        range_y=[-90,90],
        width=800,
        height=800,
        title="全球地震散点图",
        size="震级",
        size_max=10,
    )
    fig.write_html("global_earthquakes.html")
    fig.show()
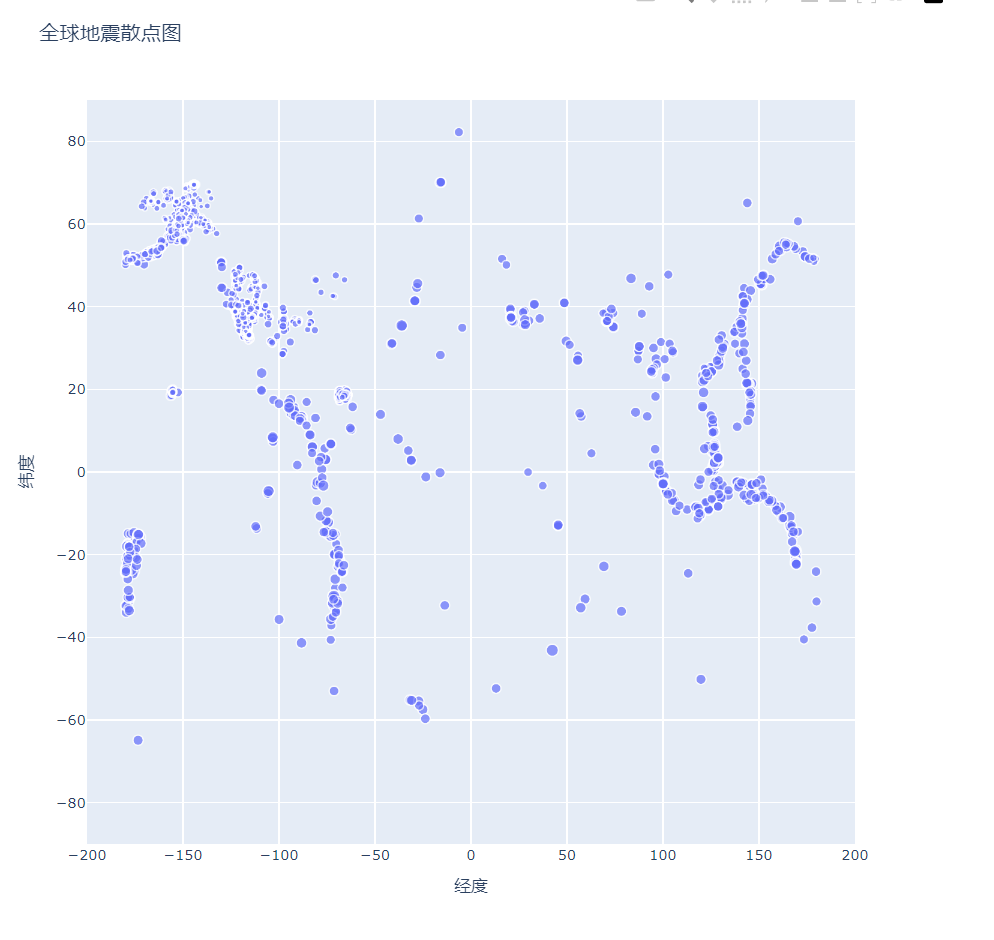
fig = px.scatter(
        data,
        x="经度",
        y="纬度",
        range_x=[-200,200],
        range_y=[-90,90],
        width=800,
        height=800,
        title="全球地震散点图",
        size="震级",
        size_max=10,
    # 震级有颜色等级
        color="震级"
    )
    fig.write_html("global_earthquakes.html")
    fig.show()
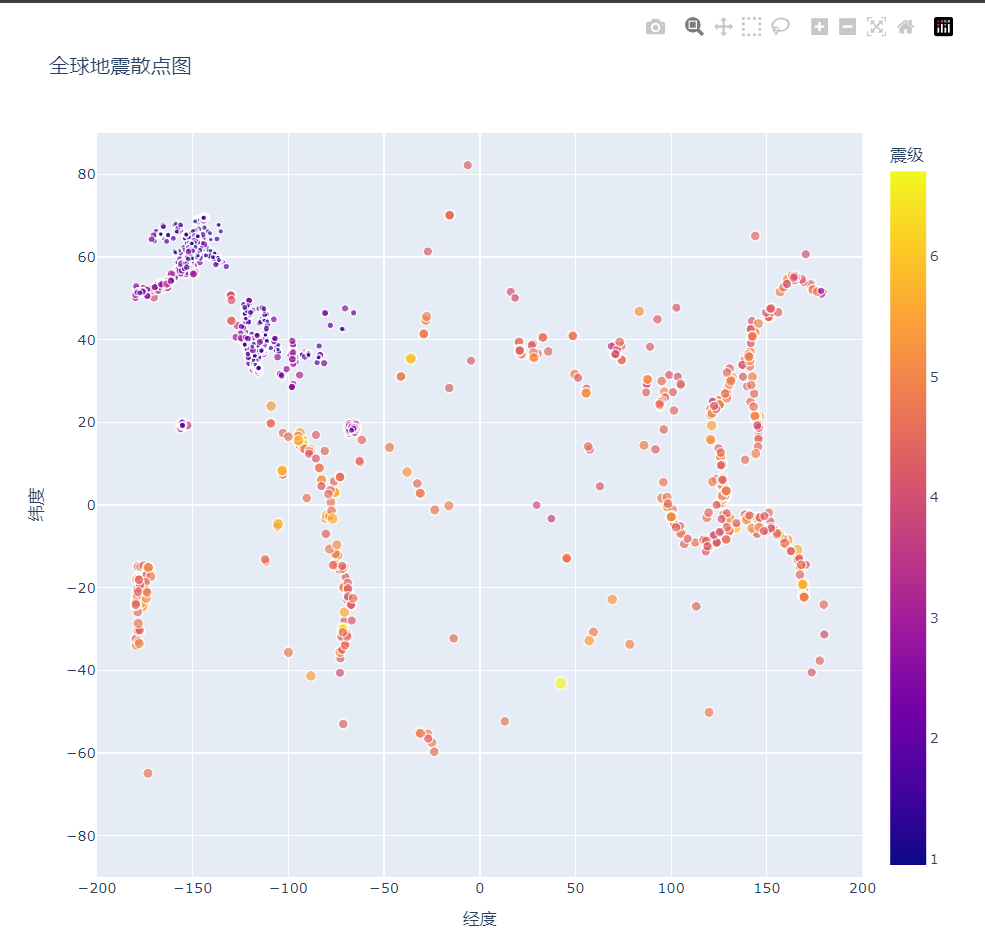
fig = px.scatter(
        data,
        x="经度",
        y="纬度",
        range_x=[-200,200],
        range_y=[-90,90],
        width=800,
        height=800,
        title="全球地震散点图",
        size="震级",
        size_max=10,
        color="震级",
        # 鼠标指向时显示的文本 这里显示的是data里面的位置
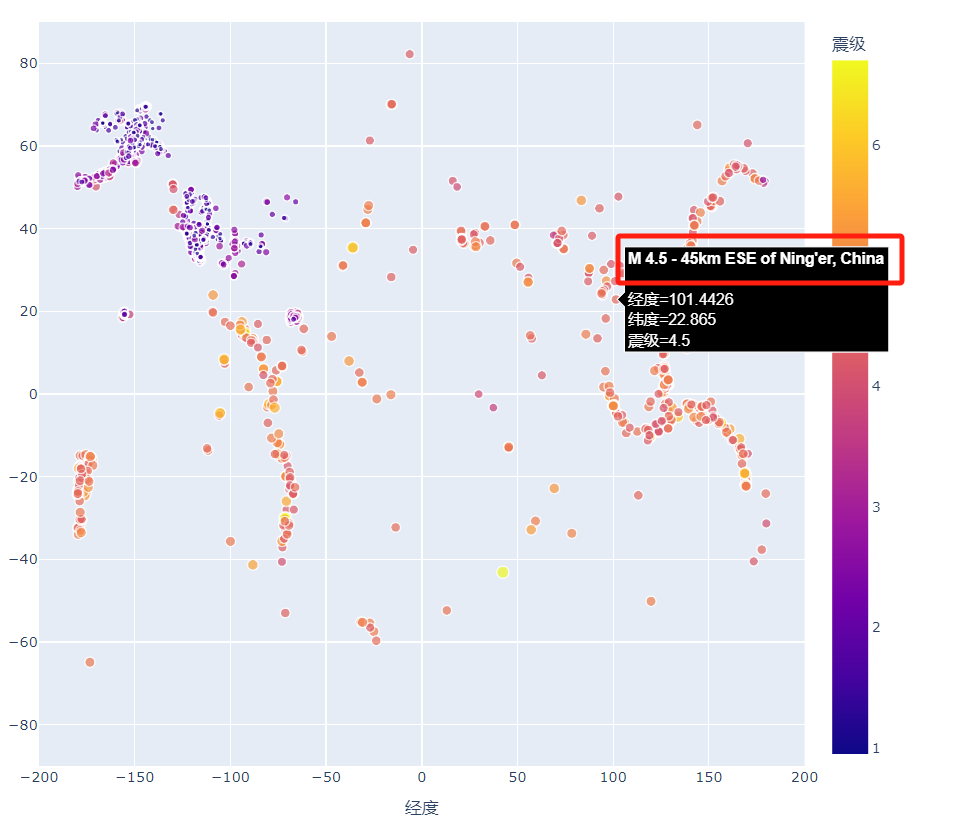
        hover_name="位置"
    )
