当前位置: 首页 > article >正文

Layui弹窗之图表绘制

1、首先要将弹窗中绘制图表的容器宽高设置为100%

<style>
  #eleChartLayerBar {
    width: 100%;
    height: 100%;
    // height: calc(100% - 40px) // 调整高度
  }
</style>
<script type="text/html" id="eleChartLayer-tpl">
  <div id="eleChartLayerBar"></div>
</script>

2、然后将弹窗中的事件添加上去,进行重绘

var tpl  = $("#eleChartLayer-tpl").html();
let myChart = null
layer.open({
    type: 1,
    title: '详情',
    content: tpl,
    skin: 'demo-class',
    maxmin: !0,
    shade: [0.2, '#ccc'],
    area: ["800px", "500px"],
    btn: ["关闭"],
    success: function(e, t) {// 弹框弹出时调用
        let option = echartDraw(types,xData,seriseData)
        let echartDom = $('#eleChartLayerBar')[0]
        myChart = echarts.init(echartDom, 'blue')
        myChart.clear();
        myChart.setOption(option,true)
        window.onresize = function () {
            myChart.resize()
        }
    },
    yes: function(e, t) {
        layer.closeAll()
    },
    full: function(){ // 放大
        myChart.resize()
    },
    restore: function(){ // 还原
        myChart.resize()
    },
})
form.render(); 

3、图表绘制代码:

let echartDraw = () => {
   var option = {
       grid: {
           left: '3%',
           right: '4%',
           bottom: '3%',
           top: 50,
           containLabel: true
       },
       tooltip: {
           trigger: 'axis',
           axisPointer: {
               type: 'cross',
               crossStyle: {
                   color: '#999'
               }
           }
       },
       xAxis: [
           {
               type: 'category',
               data: ['周一', '周二', '周三', '周四', '周五', '周六', '周日'],
               axisPointer: {
                   type: 'shadow'
               },
               axisTick: {
                   // show: true
               },
               axisLabel: {
                   align: 'right'
               }
           }
       ],
       yAxis: [
           {
               type: 'value',
               name: 'y轴',
               axisLabel: {
                   formatter: '{value} %'
               }
           }
       ],
       series: [
           {
               name: 'y轴',
               type: 'bar',
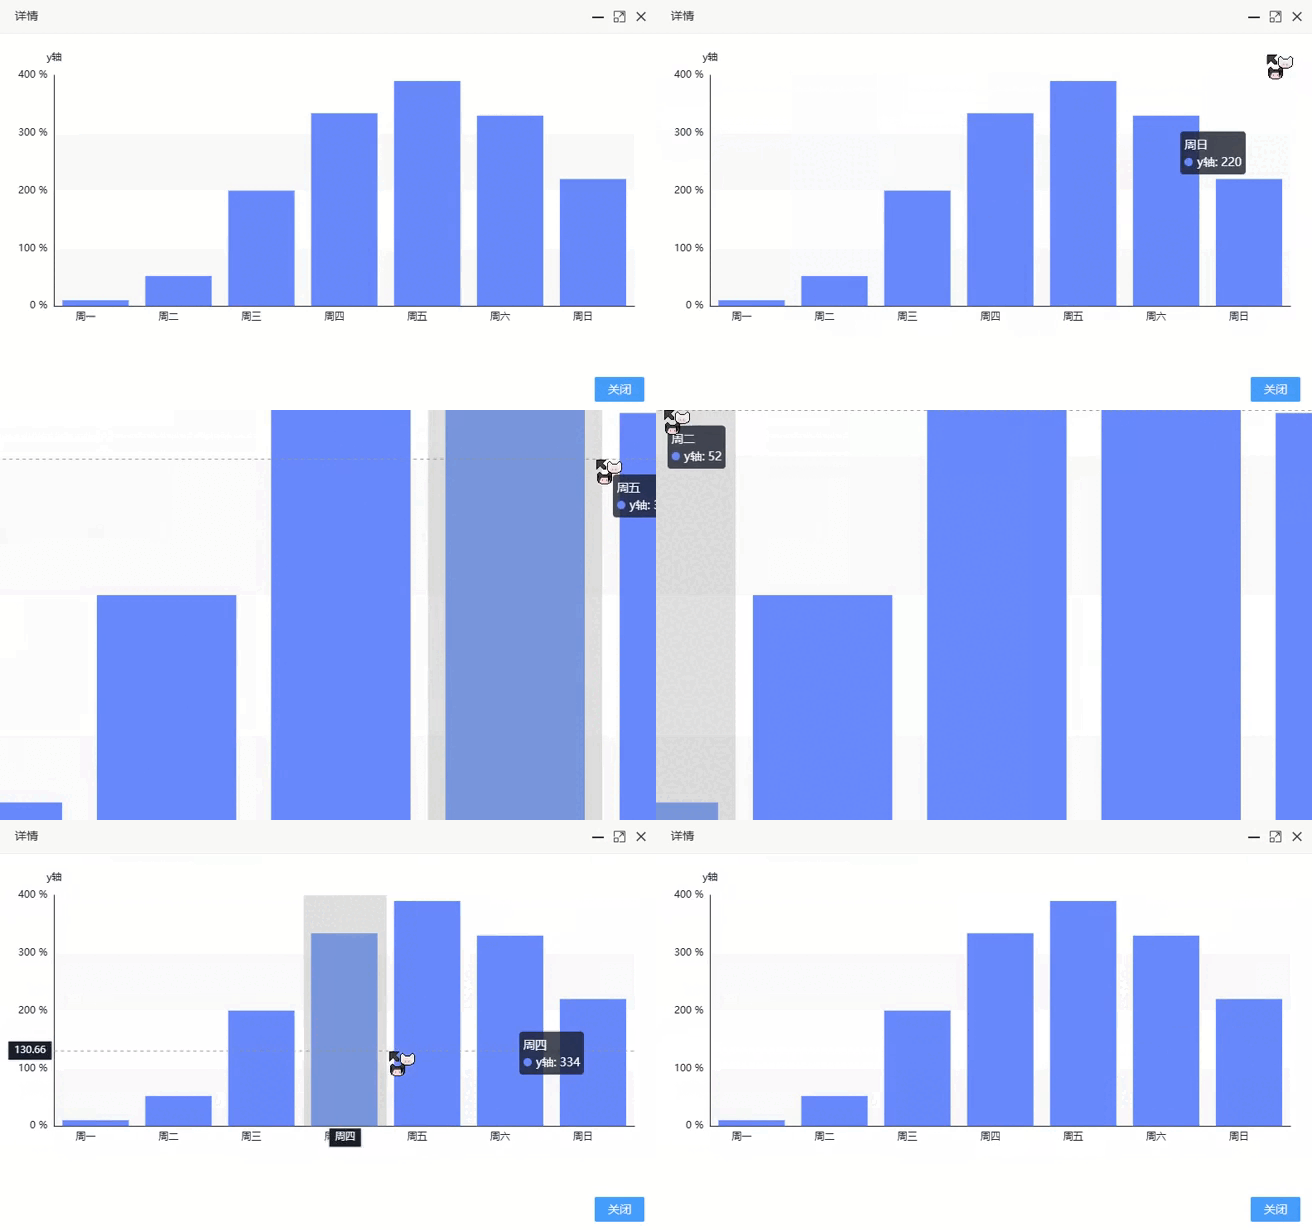
               data: [10, 52, 200, 334, 390, 330, 220]
           }
       ]
   }
   return option
}

4、效果图:
在这里插入图片描述


http://www.kler.cn/a/413414.html

相关文章:

  • 路由引入中次优路由和路由环路问题
  • 【人工智能】深入解析GPT、BERT与Transformer模型|从原理到应用的完整教程
  • Paddle Inference部署推理(八)
  • urllib3只支持OpenSSL1.1.1
  • 大模型开发中LCEL与LLMChain响应度的对比
  • 前端:base64的作用
  • 安全设备-日志审计-数据管理
  • 如何利用python爬虫获得店铺的所有商品
  • 使用client-go在命令空间test里面对pod进行操作
  • 云计算的计算包括哪些内容
  • JVM 性能调优 -- CMS 垃圾回收器 GC 日志分析【Full GC】
  • tongweb安全整改(by cz)
  • windows C#-使用反射访问特性
  • (笔记)简单了解ZYNQ
  • 【dvwa靶场:File Upload系列】File Upload低-中-高级别,通关啦
  • 判断电脑硬盘损坏的方法
  • react16为啥要更改生命周期
  • 【智能制造-46】人机工程(工厂自动化)
  • leetcode:129. 求根节点到叶节点数字之和
  • 视图查询中投影裁剪规则的原理和解析 | OceanBase 查询优化
  • 戴尔电脑安装centos7系统遇到的问题
  • c++趣味编程玩转物联网:基于树莓派Pico控制有源蜂鸣器
  • Linux之VMware安装以及centos7安装详细教程--图解
  • 七牛云AIGC内容安全方案助力企业合规创新
  • 【软件国产化】| Windows和Linux下文件名后缀是否区分大小写
  • 重构代码之将双向关联改为单向关联