基于LSTM的文本多分类任务
概述:
LSTM(Long Short-Term Memory,长短时记忆)模型是一种特殊的循环神经网络(RNN)架构,由Hochreiter和Schmidhuber于1997年提出。LSTM被设计来解决标准RNN在处理序列数据时遇到的长期依赖问题,即难以学习时间序列中相隔较远的事件之间的关联。
LSTM模型的核心是它的细胞(cell)状态和三个控制门结构:遗忘门(forget gate)、输入门(input gate)和输出门(output gate)。
以下是对LSTM模型关键组成部分的简述:
细胞状态(Cell State):细胞状态是LSTM的核心,它贯穿于整个LSTM单元,可以传输信息到网络的遥远部分。细胞状态可以看作是信息流动的“高速公路”,它允许信息在序列的不同部分之间长期传递。
遗忘门(Forget Gate):遗忘门决定了哪些信息应该从细胞状态中丢弃。它通过一个称为sigmoid的激活函数查看上一个隐藏状态(( h_{t-1} ))和当前输入(( x_t )),并输出一个介于0到1之间的数值给每个在细胞状态中的数字。1表示“完全保留这个信息”,而0表示“完全丢弃这个信息”。
输入门(Input Gate):输入门负责更新细胞状态。首先,一个sigmoid函数决定哪些值我们将要更新,然后一个tanh函数创建一个新的候选值向量,( \tilde{C}_t ),它可以被加到状态中。在遗忘门忘记旧状态的信息后,我们将这个候选值与sigmoid门的输出相乘,决定实际要更新的状态部分。
输出门(Output Gate):最后,我们需要决定输出值。输出值是基于细胞状态的,但会是一个过滤后的版本。首先,我们运行一个sigmoid函数来决定细胞状态的哪些部分将输出。然后,我们将细胞状态通过tanh(得到一个介于-1到1之间的值)并乘以sigmoid门的输出,以决定最终的输出。
代码案例
数据采用推特上对于新冠病毒的评级
代码详情如下
加载数据与依赖
import numpy as np
import pandas as pd
import os
import matplotlib.pyplot as plt
import seaborn as sns
from sklearn.model_selection import train_test_split
from wordcloud import WordCloud
import re
from nltk.corpus import stopwords #模块包含了英语和其他语言的停用词列表。停用词是指在语言中非常常见的单词,
#加载数据
os.chdir('E:\python code\文本分类')

train_Data = pd.read_excel('Corona_NLP_train.xlsx')
test_Data = pd.read_excel('Corona_NLP_test.xlsx')

#train_data = pd.read_csv(train_path, encoding="ISO-8859-1")
数据处理
"""
----------------------------------------------------------------------------
###################       数据处理               ###################
----------------------------------------------------------------------------
"""
print(train_Data.head())
print(train_Data.columns)
print(train_Data['Sentiment'].value_counts())
print(train_Data.shape)
print(test_Data.shape)
print(train_Data.info())


#查看详情
for i in range(3):
    print(i)
    print(train_Data['OriginalTweet'][i].lower())#lower 转小写


train_Data['OriginalTweet'] = train_Data['OriginalTweet'].astype(str)


train_Data=train_Data.dropna(subset=['Location'])
test_Data=test_Data.dropna(subset=['Location'])


#调整标签
def change_sen(sentiment):

    if sentiment == "Extremely Positive":
        return 'positive'

    elif sentiment == "Extremely Negative":
        return 'negative'

    elif sentiment == "Positive":
        return 'positive'

    elif sentiment == "Negative":
        return 'negative'

    else:
        return 'netural'

train_Data['Sentiment'] = train_Data['Sentiment'].apply(lambda x: change_sen(x))
test_Data['Sentiment'] = test_Data['Sentiment'].apply(lambda x: change_sen(x))
EDA
----------------------------------------------------------------------------
###################       EDA               ###################
----------------------------------------------------------------------------
"""

# 筛选前20的地区
top_20 = train_Data['Location'].value_counts().head(20)

# 标记颜色
colors = ['#FF6347', '#FF7F50', '#FFD700', '#ADFF2F', '#00CED1',
          '#8A2BE2', '#A52A2A', '#5F9EA0', '#D2691E', '#FF1493',
          '#00BFFF', '#696969', '#008080', '#FFD700', '#9ACD32',
          '#FF4500', '#2E8B57', '#8B0000', '#B8860B', '#B0E0E6']

# 构建柱形图
top_20.plot(kind='bar', color=colors, rot=45, figsize=(12, 6))

# Add title and labels
plt.title("Top 20 Tweet Locations by Frequency")
plt.ylabel('Frequency')
plt.xlabel('Location')
plt.show()


# 查看标签的分布
plt.figure(figsize=(8, 6))
sns.countplot(x='Sentiment', data=train_Data, color='#422e9e')
plt.title("Sentiment Distribution")
plt.xlabel("Sentiment")
plt.ylabel("Count")
plt.show()


#查看内容的分布
#isinstance() 是一个内置函数,用来检查一个对象是否是一个特定类或继承自该类的实例。
text = ' '.join(tweet for tweet in train_Data['OriginalTweet'] if isinstance(tweet,str))

Wordcloud = WordCloud(width=800 , height= 400,background_color='white').generate(text)

plt.figure(figsize=(10,5))
plt.imshow(Wordcloud,interpolation='bilinear')
plt.axis('off')
plt.show()


#查看文本的平均长度
text_len = [len(i) for i in train_Data['OriginalTweet']]
# 绘制箱型图
plt.boxplot(text_len)  # 设置vert=False让箱型图水平显示
plt.title('Boxplot of String Lengths')
plt.xlabel('Length of Strings')
plt.xticks([])  # 不显示x轴的刻度
plt.show()

# 绘制柱形图
sns.histplot(text_len, bins=30, kde=True, color="#eb4034")
plt.title("Tweet Length Distribution")
plt.show()
前20地区的分布

类别分布

中间出现的词汇频率

特征工程
"""
----------------------------------------------------------------------------
###################      特征工程              ###################
----------------------------------------------------------------------------
"""
X = train_Data['OriginalTweet'].copy()

y = train_Data['Sentiment'].copy()


def data_cleaner(tweet):

    # 删除 http
    #sub 是re模块中的一个函数,用于替换字符串中符合正则表达式的部分。
    #\S+ 匹配一个或多个非空白字符
    # 删除 http 开头的连续的字符直到第一个空格
    tweet = re.sub(r'http\S+', ' ', tweet)

    #test = re.sub(r'http\S+', ' ', 'http:www.baidu.com test')
    #print(test)

    # 去除<>
    #.*? 是一个非贪婪匹配,.匹配除了换行符之外的任何单个字符,* 表示“零个或多个”的意思,? 使得.*变成非贪婪模式,意味着它会匹配尽可能少的字符。
    #*? 无线的匹配,如果精确的匹配加 .
    tweet = re.sub(r'<.*?>',' ', tweet)

    #test = re.sub(r'--*?', ' ', '<a---> test')
    #print(test)

    # 删除数字
    #\d 匹配任何数字字符(0-9)
    #+ 表示匹配前面的字符(在这里是\d)一次或多次。
    tweet = re.sub(r'\d+',' ', tweet)

    #test = re.sub(r'\d+',' ', '<a-123--> test')
    #print(test)

    # 删除一些和字符组合在一起的脏数据 #
    tweet = re.sub(r'#\w+',' ', tweet)
    #test = re.sub(r'#\w+',' ', 'Hello #world, this --s a #test tweet')
    #print(test)


    # 删除和字母组合在一起的脏数据 @
    tweet = re.sub(r'@\w+',' ', tweet)

    #添加停止测
    tweet = tweet.split()

    tweet = " ".join([word for word in tweet if not word in stop_words])

    return tweet


stop_words = stopwords.words('english')
#调整字符
X_cleaned = X.apply(data_cleaner)
#查看数据
X_cleaned.head()
token 转化
from tensorflow.keras.preprocessing.text import Tokenizer
from tensorflow.keras.preprocessing.sequence import pad_sequences


# 加载token
tokenizer = Tokenizer()
tokenizer.fit_on_texts(X_cleaned)

#转换
X = tokenizer.texts_to_sequences(X_cleaned)

# 向量表
vocab_size = len(tokenizer.word_index) + 1
print(f"向量表: {vocab_size}")

# 查看赌赢数据的详情
print(f"\nSentence:\n{X_cleaned[6]}")
print(f"\nAfter tokenizing:\n{X[6]}")

#对数据长度和截断和填充 默认最大长度 ,从尾部填充
# X_padded = pad_sequences(X, maxlen=5, padding='post')
X = pad_sequences(X, padding='post')
print(f"\nAfter padding:\n{X[6]}")
调整标签
"""
----------------------------------------------------------------------------
###################      调整标签              ###################
----------------------------------------------------------------------------
"""


text = {"netural":0, "positive":1,"negative":2}
train_Data['Sentiment'] = train_Data['Sentiment'].map(text)

y.replace(text, inplace=True)

print(y.shape)
模型训练
import tensorflow as tf
from tensorflow.keras import layers as L
from tensorflow.keras.losses import SparseCategoricalCrossentropy #适用于稀疏标签数据的交叉熵损失函数


# Hyperparameters
EPOCHS = 10
BATCH_SIZE = 32
embedding_dim = 16
units = 256


# Define the model
model = tf.keras.Sequential([
    # 用于将输入的整数序列转换为密集的向量表示。vocab_size应该被替换为词汇表的大小。
    L.Embedding(vocab_size, embedding_dim),

    #一个双向的LSTM层,它能够处理序列数据并且提供前向和后向的上下文信息。
    #units是LSTM层中单元的数量。return_sequences=True表示LSTM层的每个时间步都会返回一个输出,
    #这在后面接GlobalMaxPool1D层时是必需的
    L.Bidirectional(L.LSTM(units, return_sequences=True)),

    #全局最大池化层,它会沿着时间维度对序列进行最大值池化,从而减少输出的维度。
    L.GlobalMaxPool1D(),

    L.Dropout(0.4),

    #层:一个全连接层,这里用于实现非线性变换,activation="relu"指定了Rectified Linear Unit激活函数。
    L.Dense(64, activation="relu"),
    L.Dropout(0.4),
    L.Dense(3)  #最后输出3个结果
])

# Compile the model
model.compile(
    #定义损失函数损失函数是SparseCategoricalCrossentropy,它适用于整数标签的稀疏分类问题
    #并且设置from_logits=True表示输入的是未经激活的logits
    loss=SparseCategoricalCrossentropy(from_logits=True),

    optimizer='adam',
    metrics=['accuracy']
)

# 清除之前的TensorFlow会话,释放资源,并确保后续的模型训练不受之前会话的影响。
tf.keras.backend.clear_session()


history = model.fit(X, y, epochs=EPOCHS, validation_split=0.12, batch_size=BATCH_SIZE)
结果如下:
Epoch 1/10
896/896 [] - 78s 82ms/step - loss: 0.7185 - accuracy: 0.6824 - val_loss: 0.4261 - val_accuracy: 0.8526
Epoch 2/10
896/896 [] - 57s 64ms/step - loss: 0.3591 - accuracy: 0.8832 - val_loss: 0.3745 - val_accuracy: 0.8741
Epoch 3/10
896/896 [] - 68s 76ms/step - loss: 0.2382 - accuracy: 0.9257 - val_loss: 0.4173 - val_accuracy: 0.8677
Epoch 4/10
896/896 [] - 73s 81ms/step - loss: 0.1755 - accuracy: 0.9465 - val_loss: 0.4795 - val_accuracy: 0.8529
Epoch 5/10
896/896 [] - 73s 82ms/step - loss: 0.1394 - accuracy: 0.9556 - val_loss: 0.5664 - val_accuracy: 0.8450
Epoch 6/10
896/896 [] - 79s 88ms/step - loss: 0.1119 - accuracy: 0.9642 - val_loss: 0.6328 - val_accuracy: 0.8401
Epoch 7/10
896/896 [] - 58s 64ms/step - loss: 0.0923 - accuracy: 0.9699 - val_loss: 0.7140 - val_accuracy: 0.8281
Epoch 8/10
896/896 [] - 80s 89ms/step - loss: 0.0731 - accuracy: 0.9760 - val_loss: 0.7973 - val_accuracy: 0.8191
Epoch 9/10
896/896 [] - 74s 83ms/step - loss: 0.0566 - accuracy: 0.9822 - val_loss: 0.9219 - val_accuracy: 0.8133
Epoch 10/10
896/896 [] - 52s 58ms/step - loss: 0.0472 - accuracy: 0.9851 - val_loss: 1.0420 - val_accuracy: 0.8140
模型验证
"""
----------------------------------------------------------------------------
###################      模型验证             ###################
----------------------------------------------------------------------------
"""


plt.figure(figsize=(10, 6))
plt.plot(history.history['accuracy'], label='Training Accuracy', color='blue')
plt.plot(history.history['val_accuracy'], label='Validation Accuracy', color='orange')
plt.xlabel('Epoch')
plt.ylabel('Accuracy')
plt.title('Training and Validation Accuracy')
plt.legend()
plt.show()


#测试处理
X_test = test_Data['OriginalTweet'].copy()
y_test = test_Data['Sentiment'].copy()

X_test = X_test.apply(data_cleaner)

X_test = tokenizer.texts_to_sequences(X_test)

X_test = pad_sequences(X_test, padding='post')

y_test.replace(text, inplace=True)


loss, acc = model.evaluate(X_test,y_test,verbose=0)
print('测试集损失: {}'.format(loss))
print('测试集准确率: {}'.format(acc))


pred = model.predict(X_test).argmax(axis=1)
#混淆矩阵
print("Unique values in y_test:", y_test.unique())
print("Unique values in pred:", np.unique(pred))

pred = pred.astype(int)


from sklearn.metrics import confusion_matrix
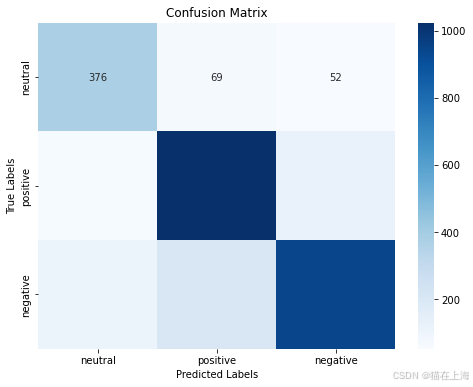
conf = confusion_matrix(y_test, pred)


labels = ['neutral', 'positive', 'negative']
cm = pd.DataFrame(conf, index=labels, columns=labels)


import matplotlib.pyplot as plt
import seaborn as sns

plt.figure(figsize=(8, 6))
sns.heatmap(cm, annot=True, fmt='d', cmap='Blues')
plt.xlabel('Predicted Labels')
plt.ylabel('True Labels')
plt.title('Confusion Matrix')
plt.show()

