11.在 Vue 3 中使用 ECharts 实现树状图
前言
在前端开发中,数据可视化是一个非常重要的领域。ECharts 是一个由百度开源的强大图表库,支持多种图表类型,包括折线图、柱状图、饼图以及树状图等。本文将详细介绍如何在 Vue 3 项目中集成 ECharts,并实现一个树状图(Tree Chart)。
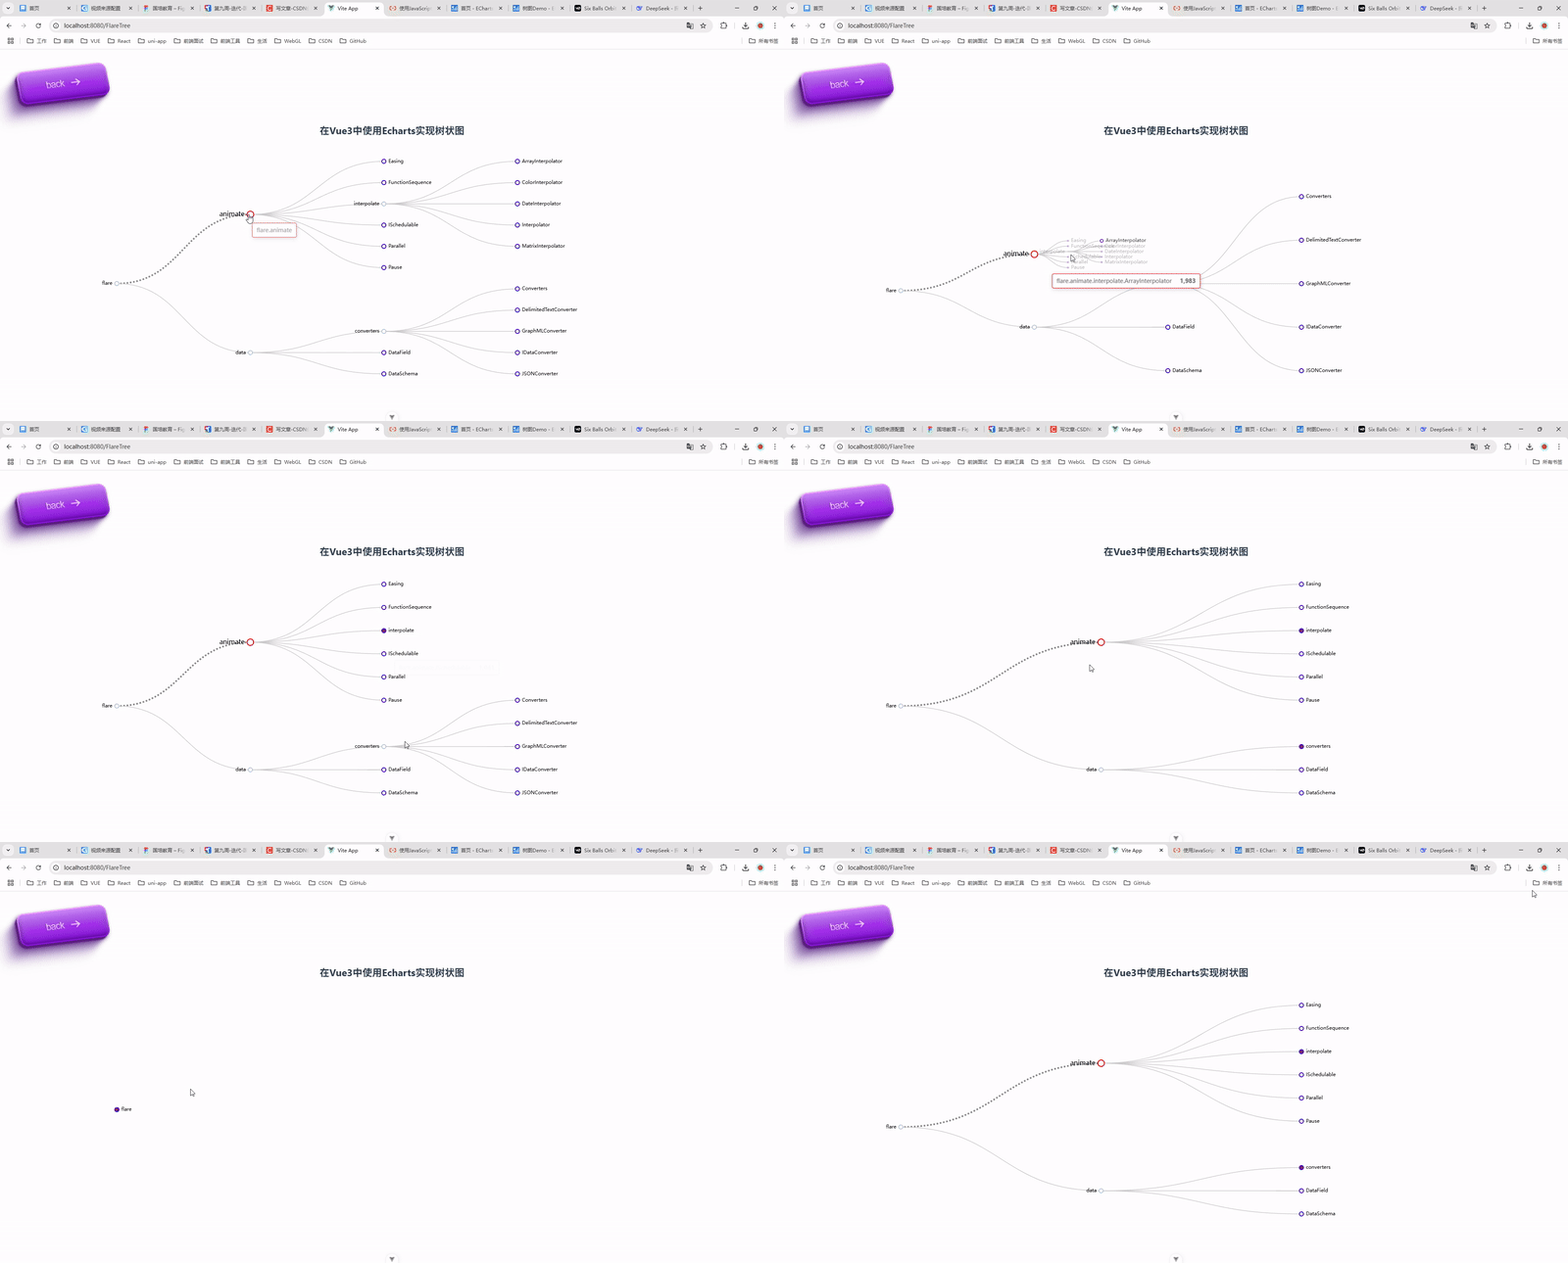
实现效果

环境准备
在开始之前,确保你已经完成以下准备工作:
-
安装 Vue 3:如果你还没有创建 Vue 3 项目,可以使用以下命令创建一个新项目:
npm init vue@latest -
安装 ECharts:在项目中安装 ECharts:
npm install echarts
实现步骤
1. 创建 Vue 组件
首先,我们创建一个 Vue 组件来承载树状图。以下是一个完整的代码示例:
<!--
 * @Author: 彭麒
 * @Date: 2025/1/18
 * @Email: 1062470959@qq.com
 * @Description: 此源码版权归吉檀迦俐所有,可供学习和借鉴或商用。
 -->
<template>
  <div class="w-full justify-start flex h-[180px] items-center pl-10">
    <BackButton @click="goBack"/>
  </div>
  <div class="font-bold text-[24px]">在Vue3中使用Echarts实现树状图</div>
  <div class="chart-container">
    <div ref="chartRef" class="tree-chart"></div>
  </div>
</template>

<script setup lang="ts">
import { ref, onMounted, onUnmounted } from 'vue'
import * as echarts from 'echarts'
import BackButton from "@/views/components/BackButton.vue";
import router from "@/router";
const goBack = () => {
  setTimeout(() => {
    router.push('/Echarts')
  }, 1000)
}
const chartRef = ref<HTMLElement | null>(null)
let chart: echarts.ECharts | null = null

const data = {
  name: "flare",
  children: [{
    name: "animate",
    symbolSize: 16,
    label: {
      fontSize: 16,
      color: "#000"
    },
    itemStyle: {
      color: "#ff0000",
      borderColor: '#0000ff',
      borderWidth: 3,
      normal: {
        color: "#00ff00"
      }
    },
    lineStyle: {
      color: "#888",
      width: 4,
      type: 'dotted'
    },
    children: [
      {
        name: "Easing",
        value: 17010
      },
      {
        name: "FunctionSequence",
        value: 5842
      },
      {
        name: "interpolate",
        children: [
          {
            name: "ArrayInterpolator",
            value: 1983
          },
          {
            name: "ColorInterpolator",
            value: 2047
          },
          {
            name: "DateInterpolator",
            value: 1375
          },
          {
            name: "Interpolator",
            value: 8746
          },
          {
            name: "MatrixInterpolator",
            value: 2202
          }
        ]
      },
      {
        name: "ISchedulable",
        value: 1041
      },
      {
        name: "Parallel",
        value: 5176
      },
      {
        name: "Pause",
        value: 449
      }
    ]
  },
    {
      name: "data",
      category: "tree2",
      label: {
        normal: {
          show: true
        }
      },
      itemStyle: {
        normal: {
          show: false,
          color: {
            type: 'radial',
            x: 0.5,
            y: 0.5,
            r: 0.5,
            colorStops: [{
              offset: 0,
              color: 'green'
            }, {
              offset: 1,
              color: 'white'
            }],
            globalCoord: false
          },
          borderColor: 'blue',
          borderWidth: 2,
          shadowColor: 'rgba(0, 0, 0, 1)',
          shadowBlur: 10
        },
        emphasis: {
          color: {
            type: 'radial',
            x: 0.5,
            y: 0.5,
            r: 0.5,
            colorStops: [{
              offset: 0,
              color: 'green'
            }, {
              offset: 1,
              color: 'white'
            }],
            globalCoord: false
          }
        }
      },
      children: [
        {
          name: "converters",
          children: [
            {
              name: "Converters",
              value: 721
            },
            {
              name: "DelimitedTextConverter",
              value: 4294
            },
            {
              name: "GraphMLConverter",
              value: 9800
            },
            {
              name: "IDataConverter",
              value: 1314
            },
            {
              name: "JSONConverter",
              value: 2220
            }
          ]
        },
        {
          name: "DataField",
          value: 1759
        },
        {
          name: "DataSchema",
          value: 2165
        }
      ]
    }]
}

const initChart = () => {
  if (!chartRef.value) return

  chart = echarts.init(chartRef.value)

  const option = {
    tooltip: {
      trigger: 'item',
      triggerOn: 'mousemove'
    },
    series: [{
      type: 'tree',
      initialTreeDepth: -1,
      data: [data],
      top: '1%',
      left: '7%',
      bottom: '1%',
      right: '20%',
      symbolSize: 10,
      label: {
        normal: {
          position: 'left',
          verticalAlign: 'middle',
          align: 'right',
          color: 'black'
        }
      },
      leaves: {
        label: {
          normal: {
            position: 'right',
            verticalAlign: 'middle',
            align: 'left',
          }
        },
        itemStyle: {
          normal: {
            color: {
              type: 'radial',
              x: 0.5,
              y: 0.5,
              r: 0.5,
              colorStops: [{
                offset: 0,
                color: 'red'
              }, {
                offset: 1,
                color: 'blue'
              }],
              globalCoord: false
            }
          }
        }
      }
    }]
  }

  chart.setOption(option)
}

const handleResize = () => {
  chart?.resize()
}

onMounted(() => {
  initChart()
  window.addEventListener('resize', handleResize)
})

onUnmounted(() => {
  chart?.dispose()
  window.removeEventListener('resize', handleResize)
})
</script>

<style scoped>
.chart-container {
  width: 70%;
  margin-left: 10%;
  height: 70%;
  min-height: 600px;
}

.tree-chart {
  width: 100%;
  height: 100%;
}

@media screen and (max-width: 768px) {
  .chart-container {
    min-height: 400px;
  }
}

@media screen and (max-width: 480px) {
  .chart-container {
    min-height: 300px;
  }
}
</style>
2. 代码解析
2.1 模板部分
-
返回按钮: 使用
BackButton组件实现返回功能。 -
标题: 显示“在Vue3中使用Echarts实现树状图”。
-
图表容器: 使用
ref绑定一个 DOM 元素,用于渲染 ECharts 图表。
2.2 脚本部分
-
数据定义:
data是一个树状结构的数据,定义了节点的名称、子节点、样式等。 -
初始化图表:
initChart函数用于初始化 ECharts 实例,并设置图表的配置项。 -
响应式调整:
handleResize函数用于在窗口大小变化时调整图表大小。 -
生命周期钩子: 在
onMounted中初始化图表并监听窗口大小变化,在onUnmounted中销毁图表实例。
2.3 样式部分
-
图表容器样式: 定义了图表容器的宽度、高度和最小高度,并设置了响应式布局。
3. 运行效果
完成代码后,运行项目,你将看到一个树状图展示在页面上。鼠标悬停在节点上时,会显示节点的详细信息。窗口大小变化时,图表会自动调整大小。
4. 总结
本文详细介绍了如何在 Vue 3 项目中集成 ECharts 并实现一个树状图。通过本文的学习,你可以掌握以下技能:
-
在 Vue 3 中使用 ECharts。
-
实现树状图的基本配置和样式定制。
-
处理图表的响应式布局。
希望本文对你有所帮助!如果你有任何问题或建议,欢迎在评论区留言。
参考文档
-
ECharts 官方文档
-
Vue 3 官方文档
版权声明:本文代码版权归吉檀迦俐所有,可供学习和借鉴或商用。
希望这篇博文对你有帮助!如果有其他需求,欢迎随时提出!
