性能测试 —— Tomcat监控与调优:status页监控_tomcat 自带监控
在本小节将对这三种监控方法进行详细的介绍。分为三章,大家记得收藏一下,防止走失~
status页监控
Status页对Tomcat监控的步骤如下:
- 步骤1:修改配置文件tomcat-users(该文件在Tomcat安装程序根目录中的conf文件夹中),添加一个admin设置权限,在中添加的内容如下:
<role rolename="admin-gui"/>
<user username="admin" password="1234" roles="manager-gui"/>
- 步骤2:修改完成后,重启Tomcat服务器,在浏览器中输入URL(http://localhost:8080/),如果是远程访问,访问的URL为http://IP:8080,如图10-4所示。
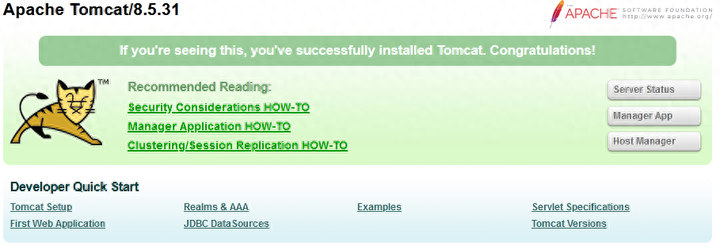
图10-4 Status Management页面
在Status Management页面,提供几种监控Tomcat的内容,主要包括Server status和Host Manager两个方面的内容。
- Server status主要是显示服务器相关的信息,主要包括:Server Information、JVM和接连器相关的内容。
- Server Information主要是显示了服务器配置的相关信息,如图10-5所示。
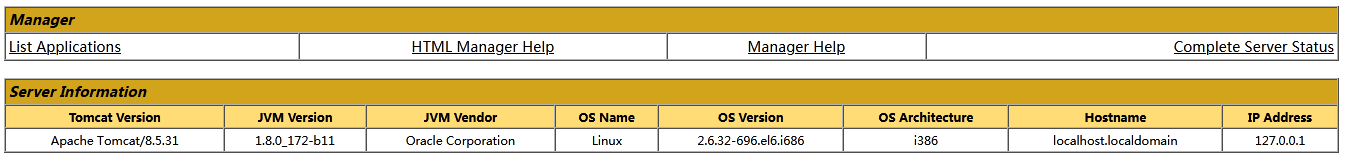
图10-5 Server Information内容
JVM部分主要显示了JVM的详细信息,包括JVM总的大小、剩余大小等相关信息,并统计了每个代所消耗内存的情况,当然如果需要看懂这些值,就必须和JVM设置相关的参数对照的来看,这样才可以更好的理解,当然如果要看详细的每个时间这个值的变化情况,这里是无法给到的。
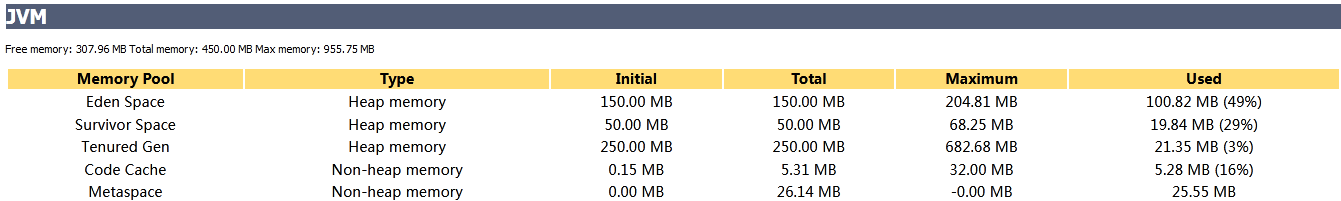
图10-6 JVM信息
Free memory:30.38 MB Total memory: 65.60 MB Max memory: 506.31 MB
Free memory:空闲内存大小;
Total memory:总内存大小;
Max mermory:最大内存大小;
接连器在这里其实有两种:ajp和http两种连接器,我们一般看到多的是http的连接器,因为一般来说都是通过HTTP来发送请求的。HTTP连接器的内容如图10-7所示。
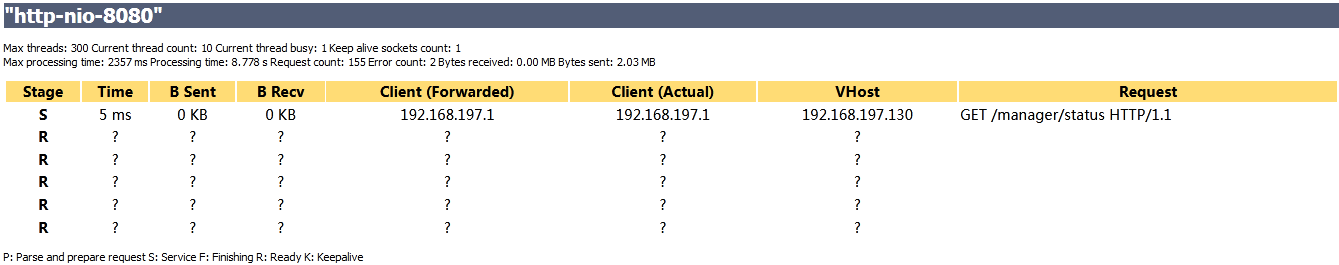
图10-7 HTTP连接器信息
Max threads: 300 Current thread count: 10 Current thread busy: 1 Keep alive sockets count: 1
Max processing time: 2357 ms Processing time: 8.778 s Request count: 155 Error count: 2 Bytes received: 0.00 MB Bytes sent: 2.03 MB
左右拉动查看完整代码
- Max threads:最大线程数;
- Min spare threads:最小空闲线程数;
- Max spare threads:最大空闲线程数;
- Current thread count:最近运行的线程数;
- thread busy:正在运行的线程数;
- Max processing time:最大CPU时间;
- Processing time:CPU消耗总时间;
- Request count:请求总数;
- Error count:错误的请求数;
- Bytes received:接收字节数;
- Bytes sent:发送字节数;
关于请求阶段的有以下几种情况: