Python(Pandas)数据分析学习
1.Pandas基本构成
引入Pandas
import pandas as pd1.Series 行
对应Excel中的一行数据,一维数据
定义Series
# 第一个参数是具体数据
# 第二个参数的对应的索引下标
# 第三个参数的行名称
data = pd.Series([1,2,3,4,5], index=['a','b','c','d','e'], name='data')
print(data)
# 输出Series对象的索引
print(data.index)
# 输出Series对象里面索引为 'a'的值
print(data['a'])
执行结果:

2.DataFrame 表
对应Excel表,二维数据,类似于二维数组,由Series组成
定义DataFrame
# 定义DataFrame
# 先定义单独的每一行
s1 = pd.Series([1, 2, 3, 4, 5], index=['a','b','c','d','e'], name='A')
s2 = pd.Series([10, 20, 30, 40, 50], index=['a','b','c','d','e'], name='B')
s3 = pd.Series([100, 200, 300, 400, 500], index=['a','b','c','d','e'], name='C')
df = pd.DataFrame([s1, s2, s3])
print(df)
# 字典方式定义
# 输出结果与上方 行列颠倒
df2 = pd.DataFrame({s1.name: s1, s2.name: s2, s3.name: s3})
print(df2)
执行结果:

2.Pandas基本操作
1.读取写入数据
1.读取数据
import pandas as pd

# 读取
# pandas读取时会自动跳过空行
# header参数可以指定跳过哪一行
# 读取时会产生默认的索引
file_path = "test.xlsx"
data = pd.read_excel(file_path, header=2, sheet_name="Sheet1")
print(data)

# index_col 指定索引列
# dtype 转换指定列的数据类型
data1 = pd.read_excel(file_path, sheet_name="Sheet1", index_col='name', dtype={"age": int})
print(data1)
执行结果

2.写入数据
# 写入
df = pd.DataFrame({
    "id": [1, 2, 3, 4, 5],
    "name": ["张三", "李四", "王五", "刘大", "关二"],
    "age": [10, 20, 30, 40, 50]
})
# 自定义索引
df = df.set_index("id")
df.to_excel("test.xlsx")
如果写入时to_excel方法报错,则下载openpyxl解决
from openpyxl import Workbook执行结果:

2.对数据进行排序
import pandas as pd

# 读取文件
people = pd.read_excel('test.xlsx', index_col="id")
# by 根据哪一列进行排序
# inplace 是否用排序后的数据集替换原来的数据,默认为False,即不替换
# ascending 是否按照升序排序,默认升序,False为降序
# na_position 设定缺失值的显示位置 first lase
people.sort_values(by="age", inplace=True, ascending=False, na_position="first")
print(people)

# 根据多个列进行排序
peoples = pd.read_excel('test.xlsx', index_col="id")
peoples.sort_values(by=["age", "name"], ascending=[True, False], inplace=True)
print(peoples)
3.数据过滤
读取列或行数据时,其索引必须存在,否则报错
import pandas as pd

people = pd.read_excel("test.xlsx", index_col="id")
# 判断数据行中是否有缺省值
print(people.isnull().any)
# 删除数据中的缺省值
people.dropna(inplace=True)
# 过滤数据中符合条件的数据
# [] 里面直接写条件
result = people[(people["name"] == "张三") & (people["age"] >= 10)]
print(result)


# 定义一个函数
def age_10_to_50(a):
    return 10 <= a <= 50


def score_10_to_50(a):
    return 0 <= a <= 60

# loc方法是读取文件行列数据的方法,可以读取指定行,列,区域的数据
result_10_to_50 = people[people["name"] == "张三"].loc[
    people["age"].apply(age_10_to_50)].loc[
    people["score"].apply(score_10_to_50)]
print(result_10_to_50)
4.Excel数据拆分
本质还是使用了字符串的split方法
import pandas as pd

people = pd.read_excel("test.xlsx", index_col="id")

# 将name拆分
df = people["name"].str.split(expand=True)
# 保存拆分出来的数据 保存前全部表中有这两列
people["姓氏"] = df[0]
people["名字"] = df[1]
print(people)
5.多表联合操作
import pandas as pd

student = pd.read_excel("test.xlsx")
score = pd.read_excel("test1.xlsx")
age = pd.read_excel("test2.xlsx")

# how 指定连接方式,默认inner 内连, left,right,outer 类似数据库多表查询
# on 用于连接的列名,必须同时存在与左右两个DataFrame对象中
# left_on,right_on 左右测用于连接的列
# left_index,right_index 如果为True,则使用左右侧的行索引作为其连接键
# sort 是否按照字典顺序通过连接键对结果DataFrame排序
# suffixes 用于重叠列的字符串后缀元组
# copy 是否总是从传递的DataFrame对象复制数据,默认为True
# indicator 如果为True,则添加一个名为_merge的特殊列,显示每列的合并信息
# fillna() 如果单元格为空,则填充指定数据
table = student.merge(score, how='left', on="id").fillna(0)
table["分数"] = table["分数"].astype(int)

table2 = table.merge(age, how='left', on="id").fillna(0)
table2["年龄"] = table2["年龄"].astype(int)

print(table2)
6.统计运算
import pandas as pd

df = pd.DataFrame([[1, 2, 3], [2, 2, 3], [3, 3, 3]], columns=['A', 'B', 'C'])
print(df)

# 求某一行平均数或列
# mean 计算平均值方法
# axis 0:按列计算 1:按行计算
# skipna:是否忽略缺失值,默认为True
print(df.mean(axis=1))
# drop 删除指定标签的行或列
# axis 0:删除索引 1:删除列
# inplace False:返回一个副本 True:在原地删除并返回None
print(df.drop("A", axis=1))

people = pd.read_excel("test1.xlsx")
columns_name = ["A", "B", "C"]
# 对行求平均值,总和
row_mean = people[columns_name].mean(axis=1)
row_sum = people[columns_name].sum(axis=1)
total = "总分"
average = "平均分"
people[total] = row_sum
people[average] = row_mean
columns_name += [total, average]
# 对列求平均值
col_mean = people[columns_name].mean()
# 给结果行中加个名字
col_mean["名称"] = "Summary"
people = people._append(col_mean, ignore_index=True)
print(people)
7.数据可视化
设置字体部分很重要
import pandas as pd
import matplotlib
import matplotlib.pyplot as plt

# 设置显示中文字体 黑体 重要
matplotlib.rcParams["font.sans-serif"] = ["SimHei"]
# 设置正常显示符合
matplotlib.rcParams["axes.unicode_minus"] = False

# 解决matplotlib版本与pandas冲突
matplotlib.use("TkAgg")
# matplotlib 常用绘图工具

students = pd.read_excel("test1.xlsx")
name = "名称"
score = "分数"
age = "年龄"
students.sort_values(by=score, inplace=True, ascending=False)
# 绘制图片
plt.bar(students[name], students[score], color="blue")
# 设置标题
plt.title("Student Score", fontsize=16)
# 设置X轴与Y轴的名称
plt.xlabel("Name", fontsize=16)
plt.ylabel("Score", fontsize=16)
# 将指定的列的数据旋转90度
plt.xticks(students[name], rotation=90, fontsize=16)
plt.tight_layout()
# 展示
plt.show()

# 绘制折线图  上方为柱状图
students.plot(y=[score, age])
plt.title("学生的分数")
plt.xticks(students.index)
plt.show()

# 散点图
students.plot.scatter(x=score, y=age)
plt.title("学生的分数年龄")
plt.ylabel("分数")
plt.xlabel("年龄")
plt.show()
输出结果:
柱状图部分

折线图部分

散点图部分

8.读写word文档
from docx import Document
# 创建文件
document = Document()
document.save("new.docx")
# 读取文件
doc = Document("new.docx")
# 循环段落
for paragraph in doc.paragraphs:
print(paragraph.text)
# 将文字写入到word文档中
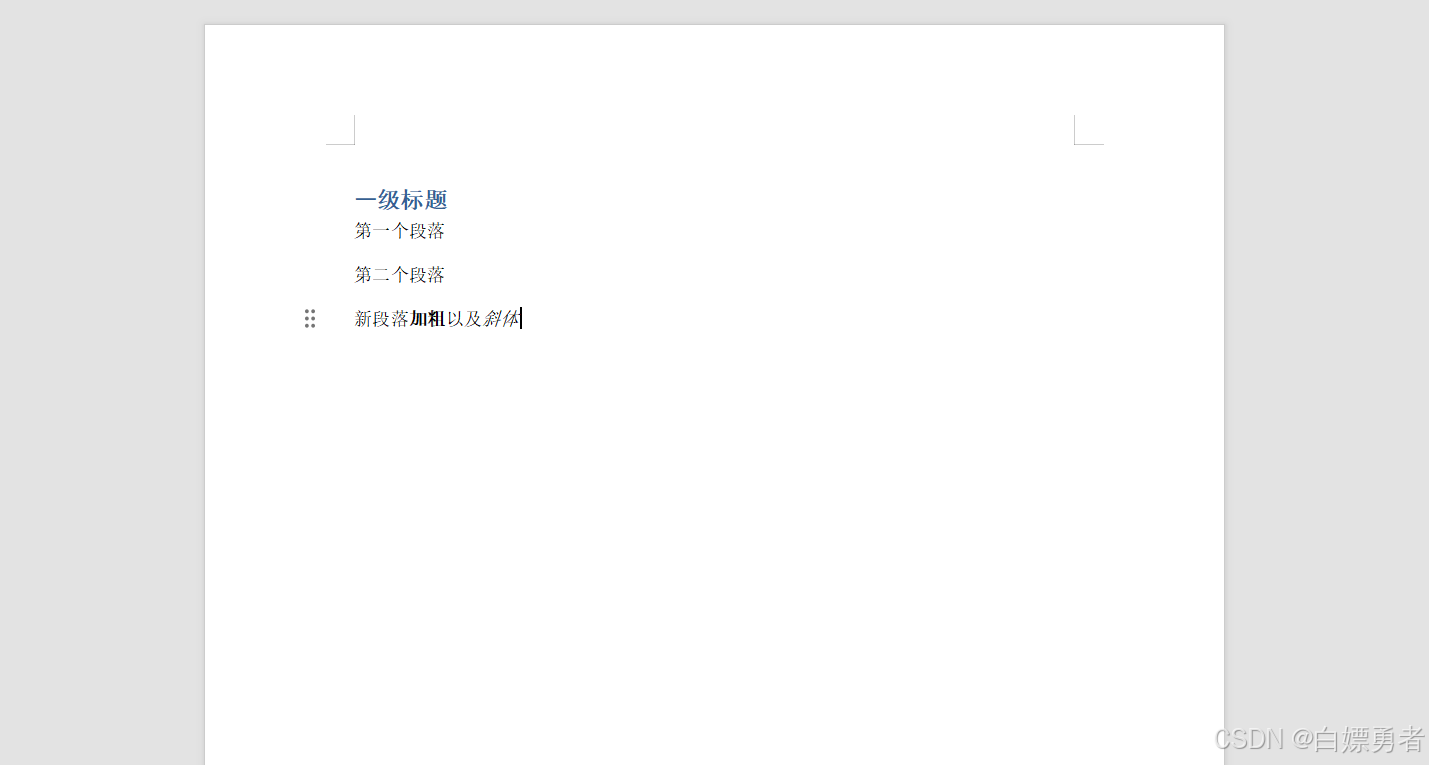
doc1 = Document()
# 添加标题
doc1.add_heading("一级标题", level=1)
# 添加段落
p2 = doc1.add_paragraph("第二个段落")
p1 = p2.insert_paragraph_before("第一个段落")
p3 = doc1.add_paragraph("新段落")
# 增加文字内容
p3.add_run("加粗").bold = True
p3.add_run("以及")
p3.add_run("斜体").italic = True
doc1.save("new1.docx")输出结果:
9.word写入图片
from docx import Document
from docx.shared import Inches

doc = Document()
doc.add_picture("p.png", width=Inches(1.25))
doc.save("new2.docx")
10.word写入表格
from docx import Document
from docx.shared import Inches

doc = Document()
# 创建table 设置行列数量
table = doc.add_table(rows=3, cols=3)
# 设置table的样式
table.style = "Table Grid"
# 获取单元格
cell = table.cell(0, 1)
# 设置单元格文本
cell.text = "第一行第二列"
p = cell.paragraphs[0]
run = p.add_run()
run.add_picture("img.png", width=Inches(2))

doc.save("new3.docx")

11.xlrd读取excel表格数据
注意版本使用
import xlrd

# xlrd新版本只支持读取xls文件,读取xlsx文件需要降为1.2.0版本
data = xlrd.open_workbook("test1.xlsx")
print(data)

# 获取第一个sheet页 三种方法
sheet = data.sheets()[0]
sheet = data.sheet_by_index(0)
sheet = data.sheet_by_name("Sheet1")
print(sheet)