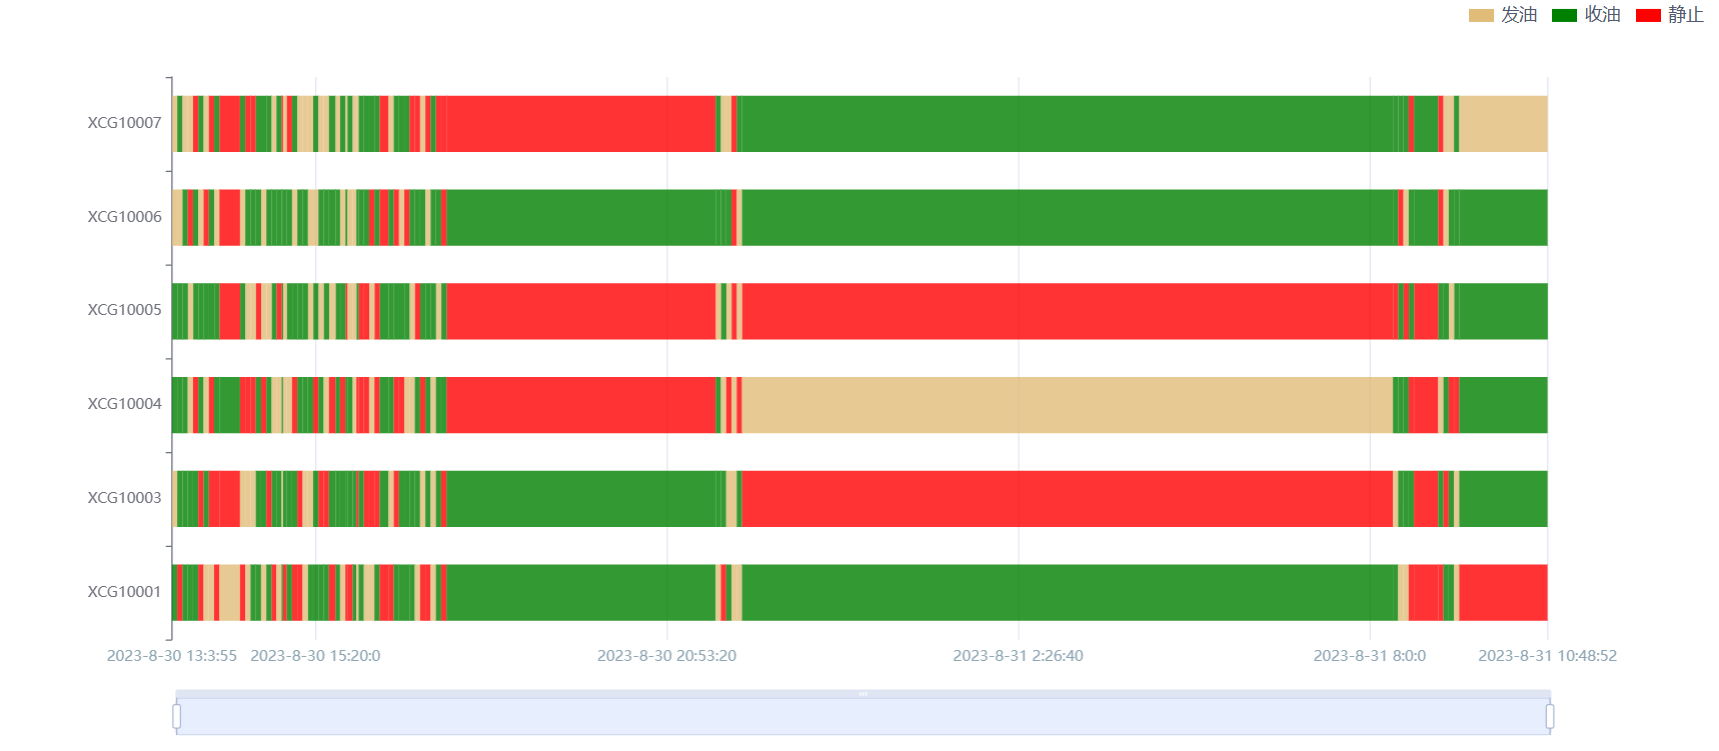
Echarts 实现 设备运行状态图(甘特图) 工业大数据展示

  let option={
        tooltip: {
          formatter: function (params) {
            let startTime = new Date(params.value[1])
            let endTime= new Date(params.value[2]);
            //北京时间/时间戳转成日常时间
            function convert(date){
              var y = date.getFullYear();
              var m = date.getMonth() + 1;
              m = m < 10 ? "0" + m : m;
              var d = date.getDate();
              d = d < 10 ? "0" + d : d;
              var h = date.getHours();
              h = h < 10 ? "0" + h : h;
              var minute = date.getMinutes();
              minute = minute < 10 ? "0" + minute : minute;
              var s = date.getSeconds();
              s = s < 10 ? "0" + s : s;
              return y + "-" + m + "-" + d + " " + h + ":" + minute + ":" + s;
            }
            return params.marker + params.name + ': ' +convert(startTime)+'-'+convert(endTime)

          }
        },

        dataZoom: [
          {
            type: 'slider',
            filterMode: 'weakFilter',
            showDataShadow: false,
            top: 550,
            labelFormatter: ''
          },
          {
            type: 'inside',
            filterMode: 'weakFilter'
          }
        ],
        grid: {
          height: 450
        },
        xAxis: {
          // min: startTime,
          scale: true,
        },
        yAxis: {
          data: []
        },
        series: [
          {
            type: 'custom',
            renderItem: function (params, api) {
              var categoryIndex = api.value(0);
              var start = api.coord([api.value(1), categoryIndex]);
              var end = api.coord([api.value(2), categoryIndex]);
              var height = api.size([0, 1])[1] * 0.6;

              var rectShape = echarts.graphic.clipRectByRect({
                x: start[0],
                y: start[1] - height / 2,
                width: end[0] - start[0],
                height: height
              }, {
                x: params.coordSys.x,
                y: params.coordSys.y,
                width: params.coordSys.width,
                height: params.coordSys.height
              });

              return rectShape && {
                type: 'rect',
                shape: rectShape,
                style: api.style()
              };
            },
            itemStyle: {
              opacity: 0.8
            },
            encode: {
              x: [1, 2],
              y: 0
            },
            data: []
          }
        ]
      }
   option.yAxis.data = this.categories//this.categories是类型也就是y轴[XCG10001....]
      let data = []
      let types = [
        {name: '静止', color: 'red'},
        {name: '收油', color: 'green'},
        {name: '发油', color: '#e0bc78'},
      ];
      let startTime = ''
      let endTime = ''
      var baseTime = ''
      var duration = ''
      this.categories.forEach((item, index) => {
        for (var i = 0; i < this.monitoringList[index].data.length; i++) {
          var typeItem = types[Math.round(Math.random() * (types.length - 1))];
          if (i !== this.monitoringList[index].data.length - 1) {
            //this.monitoringList是后台获取的数据
            endTime = new Date(this.monitoringList[index].data[i + 1].createTime);
            duration = endTime.valueOf();
            startTime = new Date(this.monitoringList[index].data[i].createTime);
            baseTime = startTime.valueOf();
          }else {
            endTime = new Date(this.monitoringList[index].data[i].createTime);
            duration = endTime.valueOf();
            startTime = new Date(this.monitoringList[index].data[i].createTime);
            baseTime = startTime.valueOf();
          }
          data.push({
            name: typeItem.name,
            // value 第一个参数: 设备 index;
            //       第二个参数: 状态的开始时间;
            //       第三个参数: 状态的结束时间;
            //       第四个参数: 状态的持续时间;
            value: [index, baseTime, endTime, duration - baseTime],
            itemStyle: {
              normal: {
                color: typeItem.color
              }
            }
          });
        }
      });
      option.series[0].data = data
     option.xAxis = {
        scale: true,
        min: function(value) {
          return value.min - 20;
        },
        max: function(value) {
          return value.max + 20;
        },
        axisLabel:{
          color:"#8da5b2",
          formatter:(value,index)=>{
            let xDate = new Date(value);
            return xDate.getFullYear()+"-"+(xDate.getMonth()+1)+"-"+xDate.getDate()+" "+xDate.getHours()+":"+xDate.getMinutes()+":"+xDate.getSeconds();
          }
        }

      }
以上就是echarts性能图的option配置
