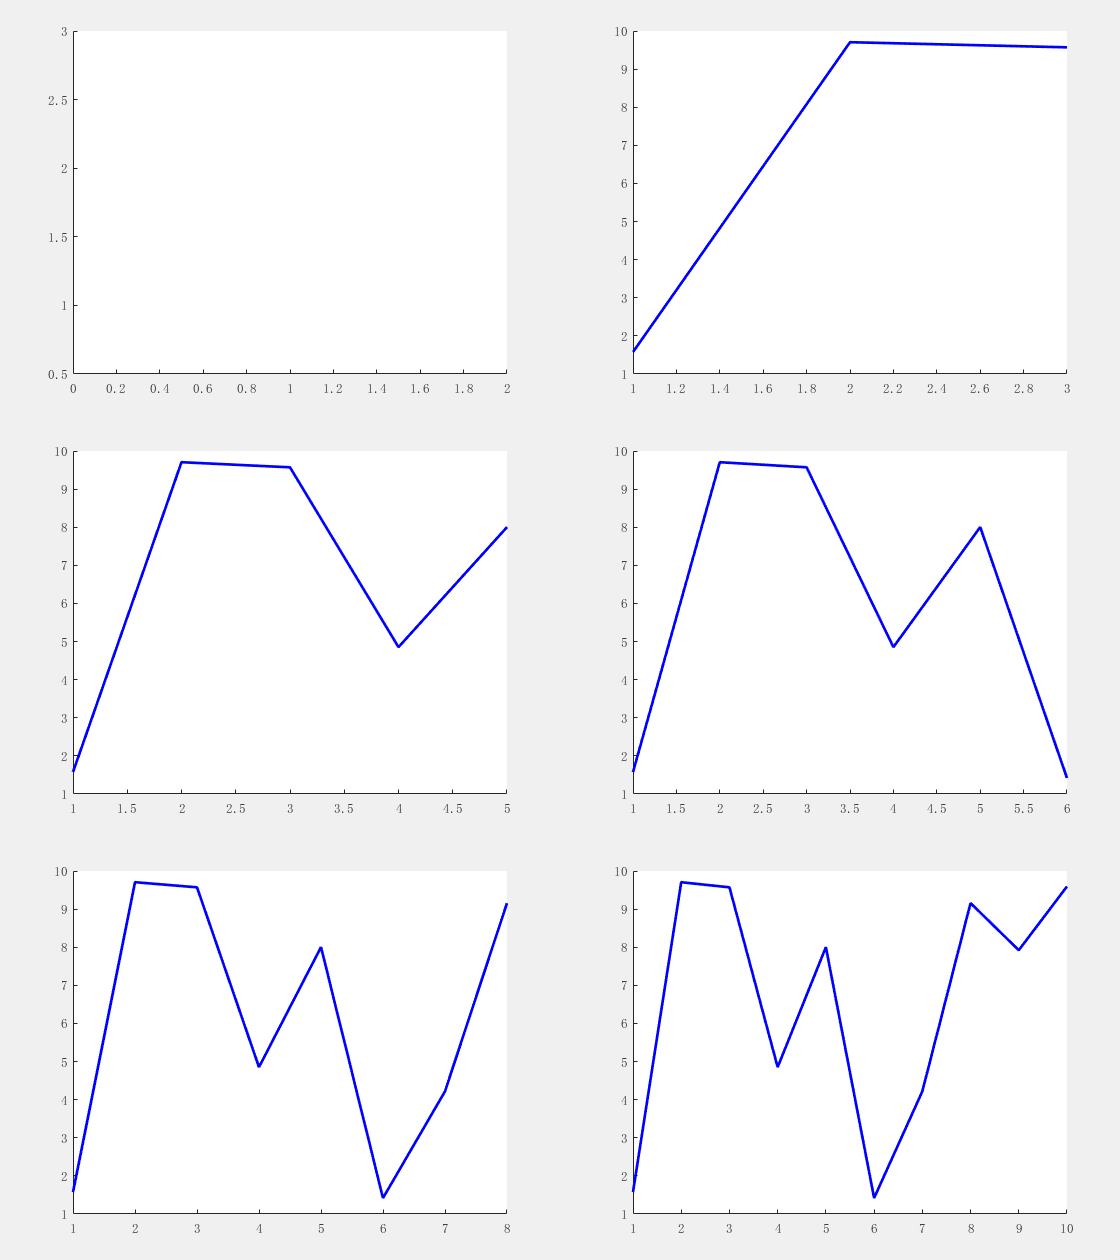
Matlab 曲线动态绘制
axes(handles.axes1); % 选定所画坐标轴 figure也可
h1 = animatedline;
h1.Color = 'b';
h1.LineWidth = 2;
h1.LineStyle = '-'; % 线属性设置
for i = 1 : length(x)
    addpoints(h1,x(i),y(i)); % x/y为待绘制曲线数据
    drawnow;
    pause(0.01); % 画点间停顿
end
示例:
figure; % 选定所画坐标轴 figure也可
x = 1:10;
y = rand(1 , 10) * 10;
h1 = animatedline;
h1.Color = 'b';
h1.LineWidth = 2;
h1.LineStyle = '-'; % 线属性设置
% pic_num = 1;
for i = 1 : length(x)
    addpoints(h1,x(i),y(i)); % x/y为待绘制曲线数据
    drawnow;
    pause(0.1); % 画点间停顿
    % F = getframe(gcf);
    % I = frame2im(F);
    % [I,map]=rgb2ind(I,256);
    % if pic_num == 1
    %     imwrite(I,map,'test.gif','gif','Loopcount',inf,'DelayTime',0.2);
    % else
    %    imwrite(I,map,'test.gif','gif','WriteMode','append','DelayTime',0.2);
    % end
    % pic_num = pic_num + 1;
end
如果需要更好的显示可以提前设置好xlim/ylim(注释掉的地方是Matlab GIF生成代码)
