引入echarts环形图及显示后端数据
实现效果:

1.下载echarts 并引用
npm install echarts --save 或 pnpm install -S echarts
项目中引用:
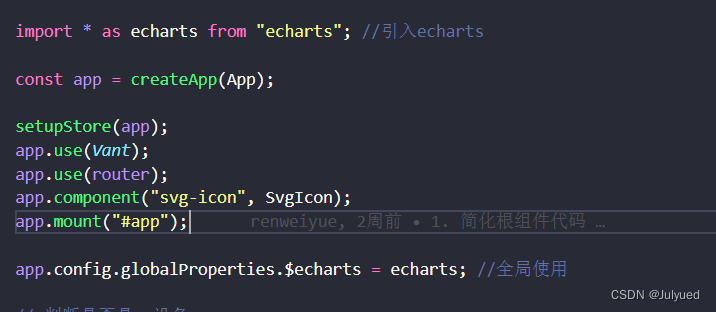
在项目main.ts中 import * as echarts from "echarts"; //引入echarts

3.页面中使用
<div id="main" class="chart" :option="option"></div>//定义一个有宽高的盒子
//图表
const echartInit = async () => {
  var chartDom = document.getElementById('main');
  var myChart = echarts.init(chartDom);
  var option;
  let datas = []
  let numAll = ('0')
//调用后台接口
  const res = await getType();
  if (res && res.code == 200) {
    datas = res.data

  }
  //总计
   datas.forEach((item) => {
     let value = parseInt(item.value)
     numAll = numAll+ value - 0
  })
  // 指定图表的配置项和数据
  option = {
    // title: {
    //   text: '诉求类型分布',
    //   left: 'center',
    //   textStyle: {
    //   color: '#fff',
    //   fontWeight: 'normal',
    //   fontSize: 18
    // }
    // },
    graphic: [
          {
            //环形图中间添加文字
            type: "text", //通过不同top值可以设置上下显示
            left: "45%",
            top: "47%",
            style: {
              text: `总计\n\n${numAll}条`,
              textAlign: "center",
              fill: "#fff", //文字的颜色
              fontSize: 12,
              lineHeight: 10,
            },
          },
        ],
    tooltip: {
      trigger: 'item'
    },
    legend: {
      // top: '5%',
      // orient: 'vertical',
      left: 'center',
      bottom: -5,
      icon: 'circle',
      textStyle: {//图例文字的样式
        color: '#fff',
        fontSize:12,
      }

    },
    color:['#33ff99','#6699ff','#be99FF','#FFFF66'],//修改圆形图颜色
    series: [
      {
        name: '诉求类型',
        type: 'pie',
        radius: ['35%', '50%'],
        // center:['30%', '50%'],
        avoidLabelOverlap: true,
        minAngle: 20,//最小的扇区角度(0 ~ 360),用于防止某个值过小导致扇区太小影响交互
        itemStyle: {
          borderRadius: 10,
          borderColor: '#fff',
          borderWidth: 2
        },
        label: {
          show: false,
          normal: {
                   show: true,
                   lineHeight:10,
                   // position: 'inside',
                  formatter: '{b}{d}%\n\n{c}条', //自定义显示格式(b:name, c:value, d:百分比)
                  fontSize: 10   // 字体大小
                  },
          // position: 'center'
        },
        labelLine: {
         length: 20,
         length2: 50,
         maxSurfaceAngle: 80
        },
       emphasis:{
          shadowBlur: 10,
          hadowOffsetX: 0,
          shadowColor: 'rgba(0, 0, 0, 0.5)'
          },
        emphasis: {
          label: {
            show: true,
            fontSize: 12,
            fontWeight: 'bold'
          }
        },
        itemStyle: {
             borderColor: '#fff',
             borderWidth: -1
             },
        data: datas
      }
    ]
  };
  // 使用刚指定的配置项和数据显示图表。
  option && myChart.setOption(option);

}
可根据自己需求配置相关样式
