【图论】计算图的n-hop邻居个数,并绘制频率分布直方图
计算图的n-hop邻居个数,并绘制频率分布直方图
在图论中,n-hop邻居(或称为K-hop邻居)是指从某个顶点出发,通过最短路径(即最少的边数)可以到达的所有顶点的集合,其中n(或K)是这个最短路径的长度。换句话说,n-hop邻居就是在图中,从一个顶点出发,经过n步可以到达的所有顶点。
举个日常生活中的例子,我们的朋友是我们的1-hop邻居,我们的朋友的朋友是我们的2-hop邻居,以此类推。如果我们想找到所有与我们最多只有三层朋友关系的人(包括我们的朋友、我们的朋友的朋友、以及我们的朋友的朋友的朋友),那么这些人就是我们的3-hop邻居。
在下图中对于中间的红色节点,玫红色的就是1-hop邻居,橙色2,粉色3。

如何在networkx中计算n-hop邻居的数量?
由定义我们可以知道,只要找到某个节点通过最短路径为n的边就可以找到它的n-hop邻居了,那么我们就可以用nx.single_source_shortest_path_length。
代码如下:
import networkx as nx
def n_hop_neighbors(G, n_hop):
    """
    Calculate n-hop neighbors for each node in the graph.
    """
    n_hop_counts = {}
    for node in G.nodes():
        # n_hop_counts[node] = len(list(nx.single_source_shortest_path_length(G, node, cutoff=n_hop))) - 1
        n_hop_counts[node] = len(list(nx.single_source_shortest_path_length(G, node, cutoff=n_hop).keys())) - 1

    n_hop_array = list(n_hop_counts.values())
    return n_hop_array
绘制分布直方图
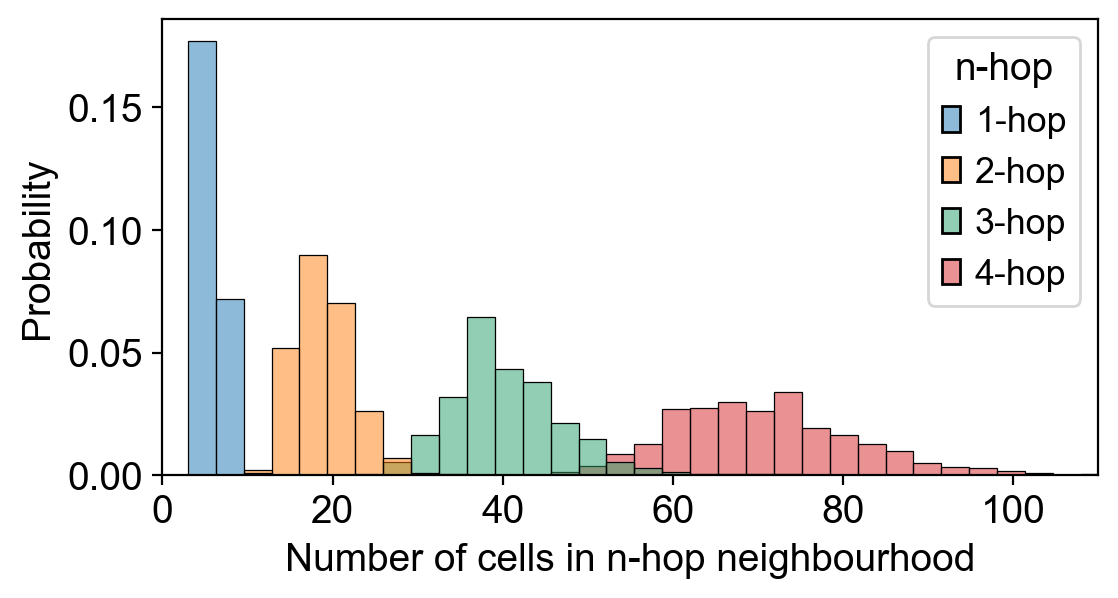
我们使用seaborn的sns.histplot来进行绘制,代码如下:
import networkx as nx
import numpy as np
import matplotlib.pyplot as plt
import seaborn as sns
# Assuming G is your NetworkX graph
# Example graph
# G = nx.Graph()
# G.add_edges_from([('v1', 'v2'), ('v2', 'v4'), ('v1', 'v3')])
plt.figure(figsize=(6, 3))

# Calculate n-hop neighbors for n=1
# n_hop_counts = n_hop_neighbors(G, 3)
# Step 1: Store n-hop counts in a dictionary
n_hop_counts_dict = {}
for i in range(1, 5): # Hop counts 1 through 4
    n_hop_counts_dict[f'{i}-hop'] = n_hop_neighbors(G, i)

# Step 2: Convert the dictionary to a DataFrame
n_hop_counts_df = pd.DataFrame(n_hop_counts_dict)

# Reshape the DataFrame to long format
n_hop_counts_long = n_hop_counts_df.melt(var_name='n-hop', value_name='Number of cells in n-hop neighbourhood')
# Plotting the histogram
sns.histplot(data=n_hop_counts_long, x="Number of cells in n-hop neighbourhood", hue="n-hop", kde=False, log_scale=False, stat="probability")
plt.xlim(0, 110)
plt.grid(False)
plt.show()
结果如下:

