GIS开发从0到1|MapboxGL可视化项目实战教程(含步骤说明和代码展示)2
客户端可视化矢量瓦片
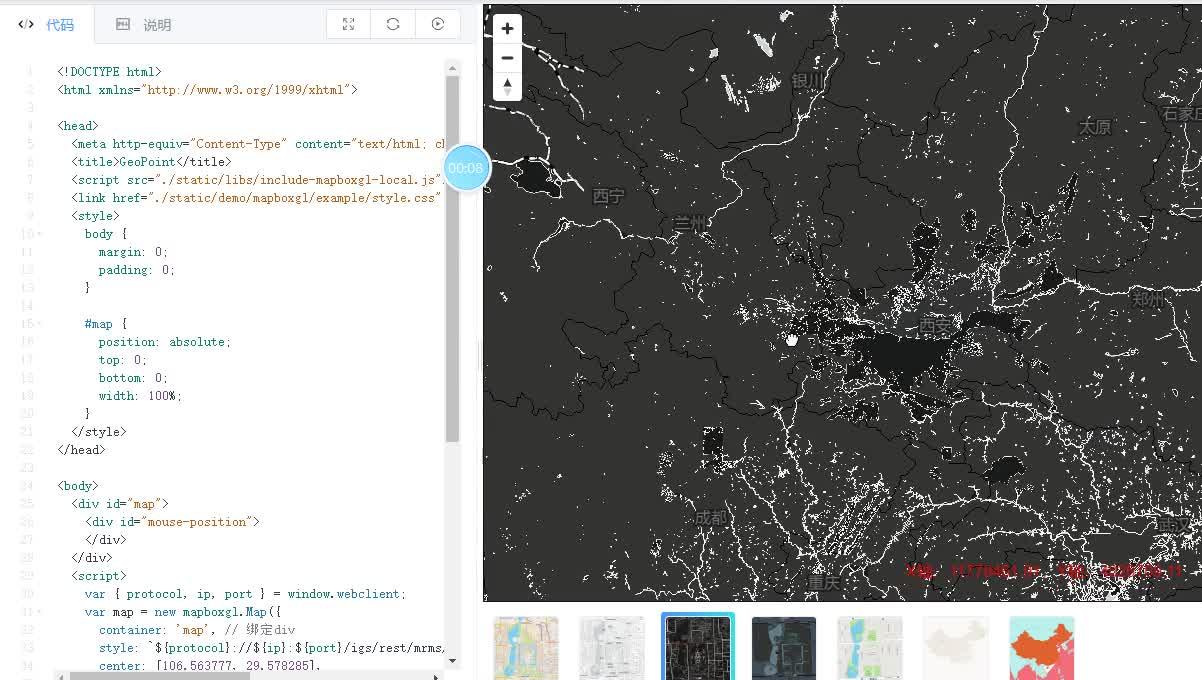
黑暗样式
示例功能
使用MapGIS IGServer配置矢量瓦片的显示样式,配置的样式信息保存为xxx.json文件,上传文件到MapGIS IGServer服务器,客户端通过接口即可访问定制样式的矢量瓦片。本示例通过MapGIS IGServer矢量瓦片配置界面,配置矢量瓦片黑暗地图样式。
示例实现
本示例需要使用【include-mapboxgl-local.js】开发库实现,通过关键接口mapboxgl.Map()实现MapGIS矢量瓦片的加载。
开发库使用请参见 首页- 概述- 原生JS调用内容
1.MapGIS桌面工具裁剪矢量瓦片
(1)准备矢量地图文档

(2)矢量瓦片裁剪:设置输入瓦片索引区要素类,其他选项使用默认值

(3)矢量瓦片裁剪:选择一个空文件夹用来存放生成的矢量瓦片文件,高级设置中将最小显示块级别修改为0,其他选项使用默认值


(4)矢量瓦片裁剪:附加裁剪项设置使用默认值

(5)矢量瓦片裁剪:瓦片裁剪的过程,瓦片裁剪级别越高需要的生成时间越久

(6)矢量瓦片裁剪:裁剪的结果文件展示

2.矢量瓦片的服务发布与样式管理
(1)矢量瓦片服务发布:打开MapGIS Server Manager,找到矢量瓦片发布选项

(2)矢量瓦片服务发布:选择矢量瓦片发布的格式为目录格式,选中矢量瓦片发布的数据路径

(3)矢量瓦片服务发布:点击发布的矢量瓦片的左边的预览按钮,进入对应的编辑界面
![]()
(4)矢量瓦片样式管理:按照个性化需求进行样式配色等操作

(5)矢量瓦片样式管理:样式配置完毕后, 点击左上方的保存按钮保存对应的样式json文件到当前计算机

(6)矢量瓦片样式管理:将第5步保存的文件上传到对应的服务器上, 该按钮在第3步的最右边有个绿色上传箭
![]()
(7)矢量瓦片样式管理:上传完成的提示如下

(7)矢量瓦片样式管理:以上步骤完成后得到矢量瓦片样式URL:http://localhost:6163/igs/rest/mrms/vtiles/styles/hubei-id.json,在步骤实现中通过该URL即可访问矢量瓦片地图服务
实现步骤
Step 1.引用开发库:
本示例通过本地离线【include-mapboxgl-local.js】脚本引入开发库;
Step 2. 创建布局:
创建id="map"的div作为地图容器,并设置其样式;
Step 3. 创建地图对象:
设置地图的必要参数,如地图div容器、缩放层级、中心点等,具体操作参考互联网地图目录下的天地图墨卡托示例;
Step 4. 加载矢量瓦片:
通过矢量瓦片样式URL加载MapGIS矢量瓦片地图服务;
- Example:var map = new mapboxgl.Map({ container: 'map', // 绑定div style: 'http://develop.smaryun.com:6163/igs/rest/mrms/vtiles/styles/黑暗样式.json', center: [106.563777, 29.578285], zoom: 3 }); map.addControl(new mapboxgl.NavigationControl(), 'top-left');
Step 5. 数据展示:
浏览矢量瓦片地图服务。
代码展示
<!DOCTYPE html>
<html xmlns="http://www.w3.org/1999/xhtml">

<head>
  <meta http-equiv="Content-Type" content="text/html; charset=utf-8" />
  <title>GeoPoint</title>
  <script src="./static/libs/include-mapboxgl-local.js"></script>
  <link href="./static/demo/mapboxgl/example/style.css" rel="stylesheet" type="text/css" />
  <style>
    body {
      margin: 0;
      padding: 0;
    }

    #map {
      position: absolute;
      top: 0;
      bottom: 0;
      width: 100%;
    }
  </style>
</head>

<body>
  <div id="map">
    <div id="mouse-position">
    </div>
  </div>
  <script>
    var { protocol, ip, port } = window.webclient;
    var map = new mapboxgl.Map({
      container: 'map', // 绑定div
      style: `${protocol}://${ip}:${port}/igs/rest/mrms/vtiles/styles/深色-墨卡托.json`,
      center: [106.563777, 29.578285],
      zoom: 3
    });
    map.addControl(new mapboxgl.NavigationControl(), 'top-left');
    //注册鼠标移动事件
    map.on('mousemove', function (e) {
      //经纬度坐标转web墨卡托
      const earthRad = 6378137.0;
      const x = e.lngLat.lng * Math.PI / 180 * earthRad;
      const a = e.lngLat.lat * Math.PI / 180;
      const y = earthRad / 2 * Math.log((1.0 + Math.sin(a)) / (1.0 - Math.sin(a)));
      document.getElementById('mouse-position').innerHTML = "X轴:" + x.toFixed(2) + ",Y轴:" + y.toFixed(2);
    });

  </script>


</body>

</html>
深蓝样式

<!DOCTYPE html>
<html xmlns="http://www.w3.org/1999/xhtml">

<head>
  <meta http-equiv="Content-Type" content="text/html; charset=utf-8" />
  <title>GeoPoint</title>
  <script src="./static/libs/include-mapboxgl-local.js"></script>
  <link href="./static/demo/mapboxgl/example/style.css" rel="stylesheet" type="text/css" />
  <style>
    body {
      margin: 0;
      padding: 0;
    }

    #map {
      position: absolute;
      top: 0;
      bottom: 0;
      width: 100%;
    }
  </style>
</head>

<body>
  <div id="map">
    <div id="mouse-position">
    </div>
  </div>
  <script>
    var { protocol, ip, port } = window.webclient;
    var map = new mapboxgl.Map({
      container: 'map', // 绑定div
      style: `${protocol}://${ip}:${port}/igs/rest/mrms/vtiles/styles/蓝色-墨卡托.json`,
      center: [106.563777, 29.578285],
      zoom: 3
    });
    map.addControl(new mapboxgl.NavigationControl(), 'top-left');
    //注册鼠标移动事件
    map.on('mousemove', function (e) {
      //经纬度坐标转web墨卡托
      const earthRad = 6378137.0;
      const x = e.lngLat.lng * Math.PI / 180 * earthRad;
      const a = e.lngLat.lat * Math.PI / 180;
      const y = earthRad / 2 * Math.log((1.0 + Math.sin(a)) / (1.0 - Math.sin(a)));
      document.getElementById('mouse-position').innerHTML = "X轴:" + x.toFixed(2) + ",Y轴:" + y.toFixed(2);
    });
  </script>


</body>

</html>
加载第三方

步骤说明
加载第三方
示例功能
加载第三方开放的矢量瓦片地图服务,本示例中加载MapBox提供的服务。
示例实现
本示例需要使用【include-mapboxgl-local.js】开发库实现,通过关键接口mapboxgl.Map()实现第三方矢量瓦片的加载。
开发库使用请参见 首页- 概述- 原生JS调用内容
MapBox服务
- 付费token:mapbox的token是收费的,并非免费使用 收费地址
- 编辑style:在线样式编辑地址,在MapBox官网编辑自己喜欢的样式,编辑完成后通过分享按钮获取Style URL与Access token,通过这2个参数访问编辑好样式的地图服务

实现步骤
Step 1.引用开发库:
本示例通过本地离线【include-mapboxgl-local.js】脚本引入开发库;
Step 2. 创建布局:
创建id="map"的div作为地图容器,并设置其样式;
Step 3. 创建地图对象:
设置地图的必要参数,如地图div容器、缩放层级、中心点等,具体操作参考互联网地图目录下的天地图墨卡托示例;
Step 4. 加载矢量瓦片:
通过矢量瓦片样式URL加载MapBox矢量瓦片地图服务;
- Example://一定要去mapbox注册一个key,这个key会失效的 mapboxgl.accessToken = 'pk.eyJ1IjoicGFybmRlZWRsaXQiLCJhIjoiY2o1MjBtYTRuMDhpaTMzbXhpdjd3YzhjdCJ9.sCoubaHF9-nhGTA-sgz0sA'; var map = new mapboxgl.Map({ container: 'map', // 绑定div style: 'mapbox://styles/mapbox/streets-v9', center: [106.563777, 29.578285], zoom: 3 }); map.addControl(new mapboxgl.NavigationControl(), 'top-left');
Step 5. 数据展示:
浏览矢量瓦片地图服务。
代码展示
<!DOCTYPE html>
<html xmlns="http://www.w3.org/1999/xhtml">

<head>
  <meta http-equiv="Content-Type" content="text/html; charset=utf-8" />
  <title>GeoPoint</title>
  <script src="./static/libs/include-mapboxgl-local.js"></script>
  <link href="./static/demo/mapboxgl/example/style.css" rel="stylesheet" type="text/css" />
  <style>
    body {
      margin: 0;
      padding: 0;
    }

    #map {
      position: absolute;
      top: 0;
      bottom: 0;
      width: 100%;
    }
  </style>
</head>

<body>
  <div id="map">
    <div id="mouse-position">
    </div>
  </div>
  <script>
    //一定要去mapbox注册一个key,这个key会失效的
    mapboxgl.accessToken =
      'pk.eyJ1IjoicGFybmRlZWRsaXQiLCJhIjoiY2o1MjBtYTRuMDhpaTMzbXhpdjd3YzhjdCJ9.sCoubaHF9-nhGTA-sgz0sA';
    var map = new mapboxgl.Map({
      container: 'map', // 绑定div
      style: 'mapbox://styles/mapbox/streets-v9',
      center: [106.563777, 29.578285],
      zoom: 3
    });
    map.addControl(new mapboxgl.NavigationControl(), 'top-left');
    //注册鼠标移动事件
    map.on('mousemove', function (e) {
      //经纬度坐标转web墨卡托
      const earthRad = 6378137.0;
      const x = e.lngLat.lng * Math.PI / 180 * earthRad;
      const a = e.lngLat.lat * Math.PI / 180;
      const y = earthRad / 2 * Math.log((1.0 + Math.sin(a)) / (1.0 - Math.sin(a)));
      document.getElementById('mouse-position').innerHTML = "X轴:" + x.toFixed(2) + ",Y轴:" + y.toFixed(2);
    });
  </script>


</body>

</html>
瓦片延申
00:17
步骤说明
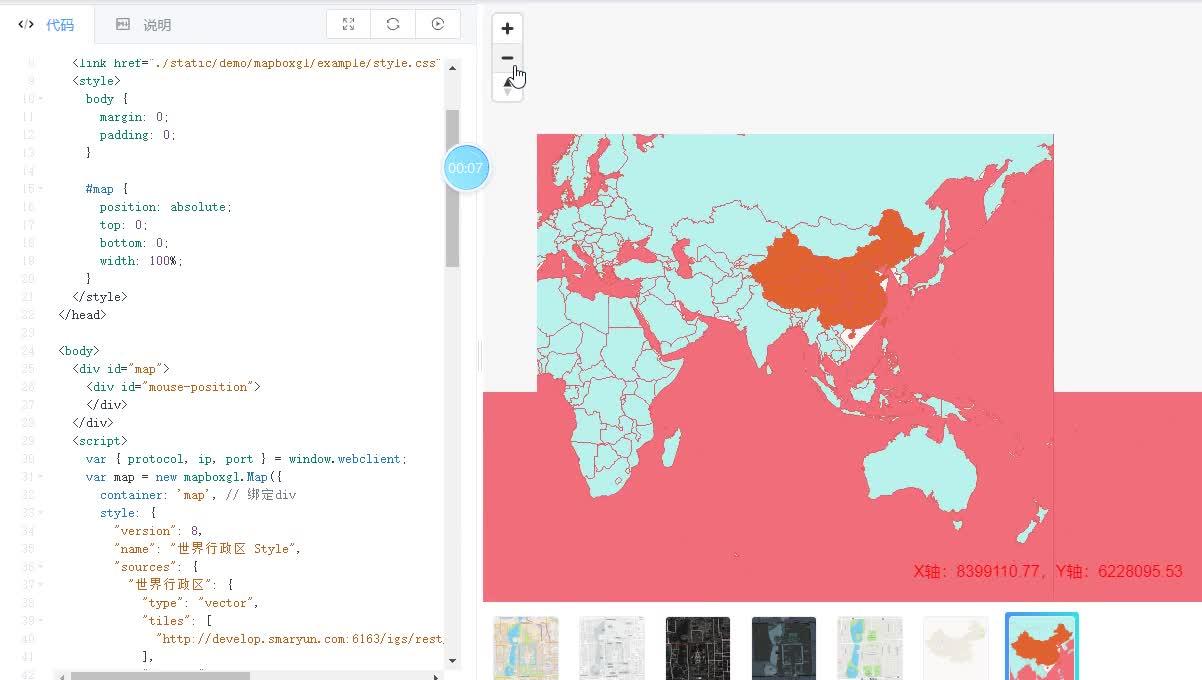
瓦片延申显示
实际在生产瓦片的时候无法一次性生产大数据大范围下的瓦片,尤其是16级以后的瓦片,因此可以利用mapboxgl延申瓦片的特性减少瓦片的裁剪
mapboxgl最大的精度为向后延申4级 默认extent4096 = 256 * 2^4
只需将图层的"maxzoom": level + 4, //往后延申设置4级为8级
桌面生产

前端修改样式
{
    "version": 8,
    "name": "世界行政区 Style",
    "sources": {
        "世界行政区": {
        "type": "vector",
        "tiles": [
            "http://develop.smaryun.com:6163/igs/rest/mrms/tile/世界行政区/{z}/{y}/{x}?type=cpbf"
        ],
        "minZoom": 0,
        "maxZoom": 4
        }
    },
    "sprite": "http://develop.smaryun.com:6163/igs/rest/mrms/vtiles/sprite",
    "glyphs": "http://develop.smaryun.com:6163/igs/rest/mrms/vtiles/fonts/{fontstack}/{range}.pbf",
    "layers": [
        {
        "id": "背景",
        "type": "background",
        "paint": {
            "background-color": "rgba(247, 247, 247, 1)"
        }
        },
        {
        "id": "世界海洋",
        "type": "fill",
        "source": "世界行政区",
        "source-layer": "世界海洋",
        "minzoom": 0,
        "maxzoom": 4,
        "layout": {
            "visibility": "visible"
        },
        "paint": {
            "fill-outline-color": "rgba(221, 92, 92, 1)",
            "fill-color": "rgba(241, 109, 122, 1)"
        }
        },
        {
        "id": "世界行政区",
        "type": "fill",
        "source": "世界行政区",
        "source-layer": "世界行政区",
        "minzoom": 0,
        "maxzoom": 4,
        "layout": {
            "visibility": "visible"
        },
        "paint": {
            "fill-outline-color": "rgba(221, 92, 92, 1)",
            "fill-color": "rgba(184, 241, 237, 1)"
        }
        },
        {
        "id": "中国",
        "type": "fill",
        "source": "世界行政区",
        "source-layer": "中国",
        "minzoom": 0,
        "maxzoom": 8, //往后延申设置4级为8级
        "layout": {
            "visibility": "visible"
        },
        "paint": {
            "fill-outline-color": "rgba(221, 92, 92, 1)",
            "fill-color": "rgba(225, 98, 47, 1)"
        }
        }
    ],
    "id": "世界行政区-id",
    "crs": null,
    "path": "D:\\平台二次开发部门资源\\阿里云服务器数据\\new\\webClient\\世界行政区\\世界行政区"
}
代码展示
<!DOCTYPE html>
<html xmlns="http://www.w3.org/1999/xhtml">

<head>
  <meta http-equiv="Content-Type" content="text/html; charset=utf-8" />
  <title>瓦片延申</title>
  <script src="./static/libs/include-mapboxgl-local.js"></script>
  <link href="./static/demo/mapboxgl/example/style.css" rel="stylesheet" type="text/css" />
  <style>
    body {
      margin: 0;
      padding: 0;
    }

    #map {
      position: absolute;
      top: 0;
      bottom: 0;
      width: 100%;
    }
  </style>
</head>

<body>
  <div id="map">
    <div id="mouse-position">
    </div>
  </div>
  <script>
    var { protocol, ip, port } = window.webclient;
    var map = new mapboxgl.Map({
      container: 'map', // 绑定div
      style: {
        "version": 8,
        "name": "世界行政区 Style",
        "sources": {
          "世界行政区": {
            "type": "vector",
            "tiles": [
              "http://develop.smaryun.com:6163/igs/rest/mrms/tile/世界行政区/{z}/{y}/{x}?type=cpbf"
            ],
            "minZoom": 0,
            "maxZoom": 4
          }
        },
        "sprite": "http://develop.smaryun.com:6163/igs/rest/mrms/vtiles/sprite",
        "glyphs": "http://develop.smaryun.com:6163/igs/rest/mrms/vtiles/fonts/{fontstack}/{range}.pbf",
        "layers": [
          {
            "id": "背景",
            "type": "background",
            "paint": {
              "background-color": "rgba(247, 247, 247, 1)"
            }
          },
          {
            "id": "世界海洋",
            "type": "fill",
            "source": "世界行政区",
            "source-layer": "世界海洋",
            "minzoom": 0,
            "maxzoom": 4,
            "layout": {
              "visibility": "visible"
            },
            "paint": {
              "fill-outline-color": "rgba(221, 92, 92, 1)",
              "fill-color": "rgba(241, 109, 122, 1)"
            }
          },
          {
            "id": "世界行政区",
            "type": "fill",
            "source": "世界行政区",
            "source-layer": "世界行政区",
            "minzoom": 0,
            "maxzoom": 4,
            "layout": {
              "visibility": "visible"
            },
            "paint": {
              "fill-outline-color": "rgba(221, 92, 92, 1)",
              "fill-color": "rgba(184, 241, 237, 1)"
            }
          },
          {
            "id": "中国",
            "type": "fill",
            "source": "世界行政区",
            "source-layer": "中国",
            "minzoom": 0,
            "maxzoom": 8, //往后延申设置4级为8级
            "layout": {
              "visibility": "visible"
            },
            "paint": {
              "fill-outline-color": "rgba(221, 92, 92, 1)",
              "fill-color": "rgba(225, 98, 47, 1)"
            }
          }
        ],
        "id": "世界行政区-id",
        "crs": null,
        "path": "D:\\平台二次开发部门资源\\阿里云服务器数据\\new\\webClient\\世界行政区\\世界行政区"
      },
      center: [106.563777, 29.578285],
      zoom: 3
    });
    map.addControl(new mapboxgl.NavigationControl(), 'top-left');
    //注册鼠标移动事件
    map.on('mousemove', function (e) {
      //经纬度坐标转web墨卡托
      const earthRad = 6378137.0;
      const x = e.lngLat.lng * Math.PI / 180 * earthRad;
      const a = e.lngLat.lat * Math.PI / 180;
      const y = earthRad / 2 * Math.log((1.0 + Math.sin(a)) / (1.0 - Math.sin(a)));
      document.getElementById('mouse-position').innerHTML = "X轴:" + x.toFixed(2) + ",Y轴:" + y.toFixed(2);
    });
  </script>


</body>

</html>
持续更新中
GIS开发学习资料分享![]() https://www.wjx.cn/vm/OaQEBVS.aspx#
https://www.wjx.cn/vm/OaQEBVS.aspx#