什么是Layer Normalization?
一、概念
前面的文章中,我们介绍了Batch Normalization。BN的目的是使得每个batch的输入数据在每个维度上的均值为0、方差为1(batch内,数据维度A的所有数值均值为0、方差为1,维度B、C等以此类推),这是由于神经网络的每一层输出数据分布都会发生变化,随着网络层数的增加,内部协变量的偏移程度会变大。我们在数据预处理阶段使用sklearn等工具进行的Normalization仅仅解决了第一层输入的问题,而隐藏层中各层的输入问题仍然存在。因此我们将BN嵌入到模型结构内部,用于把每一个batch的数据拉回正态分布。
然而,BN通过对每个维度进行正态分布处理,会使得各个维度之间的数值大小关系失真,也就是单一样本内部的特征关系被打乱了。显然,这对于处理文本向量等序列数据来说并不友好,文本向量内部的语义关系会受到BN的影响。因此,预训练模型、大语言模型等内部一般不会采用BN,而是采用Layer Normalization。
Layer Normalization对神经网络中每一层的输出进行归一化处理,确保单条样本内部各特征的均值为0、方差为1:
- 计算均值和方差:对每个样本的特征维度计算均值和方差。
- 归一化处理:使用计算出的均值和方差对当前样本进行归一化,使其均值为0,方差为1。
- 缩放和平移:引入可学习的参数进行尺度和偏移变换,以恢复模型的表达能力。
Layer Normalization能够减少训练过程中的梯度爆炸或消失问题,从而提高模型的稳定性和训练效率。尤其是在RNN和Transformer等序列模型中,LN所实现的稳定数据分布有助于模型层与层之间的信息流更加平滑。
二、LN示例
下面,我们给出一个LN的简单示例。与Batch Normalization不同,Layer Normalization不依赖于mini-batch,而是对每一个样本独立进行归一化,这使得它适用于各种数据规模,包括小批量和单个样本。
import torch
import torch.nn as nn

# 构造一个单一样本,包含5个特征
sample = torch.tensor([2.0, 3.0, 5.0, 1.0, 4.0], requires_grad=True)
print("Original Sample:", sample)

# 定义Layer Normalization层
# 特征数量(特征维度)为5
ln = nn.LayerNorm(normalized_shape=[5])

# 应用Layer Normalization
sample_norm = ln(sample)
print("Normalized Sample:", sample_norm)

# 检查均值和方差
mean = sample_norm.mean()
var = sample_norm.var()
print("Mean:", mean)
print("Variance:", var)
三、python应用
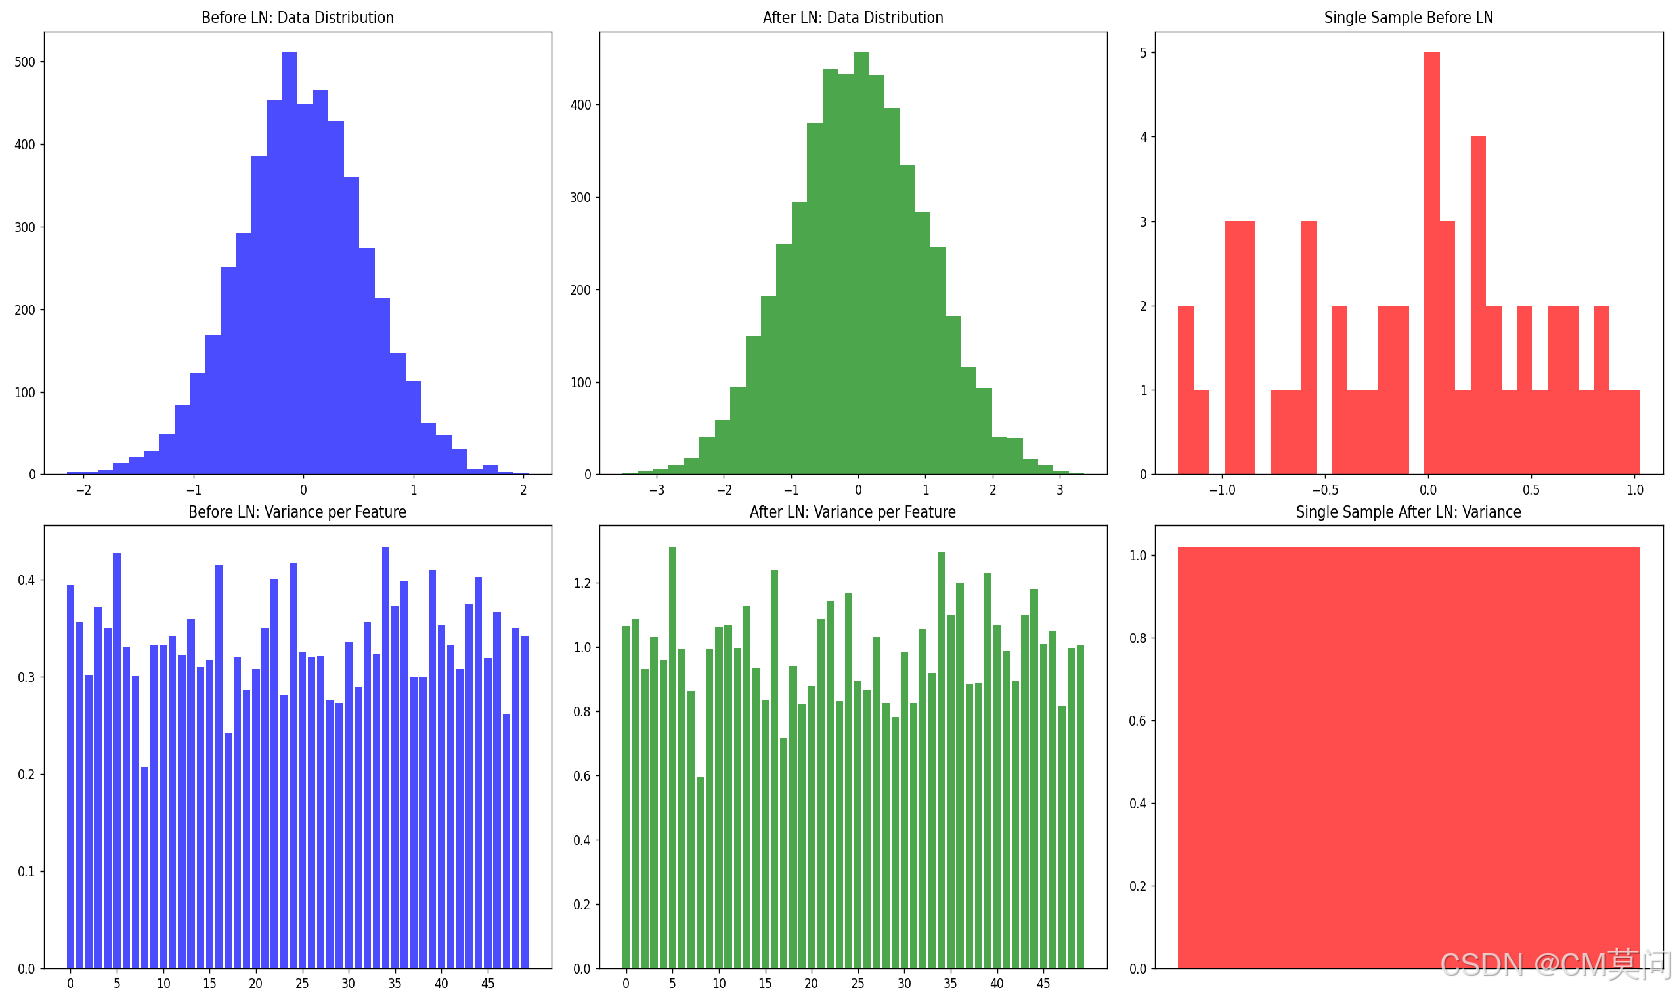
这里,我们在构建网络的过程中加入LN,并对比前后的数据差异。
import torch
import torch.nn as nn
import matplotlib.pyplot as plt

# 设置随机种子以确保结果可复现
torch.manual_seed(0)

# 创建一个简单的模型
class SimpleModel(nn.Module):
    def __init__(self):
        super(SimpleModel, self).__init__()
        self.linear = nn.Linear(100, 50)  # 一个线性层
        self.ln = nn.LayerNorm(50)  # Layer Normalization层

    def forward(self, x):
        x = self.linear(x)
        x = self.ln(x)
        return x

# 创建模型实例
model = SimpleModel()

# 生成模拟数据:100个样本,每个样本100个特征
x = torch.randn(100, 100, requires_grad=True)

# 前向传播,计算LN前的数据
x_linear = model.linear(x)
x_linear = x_linear.detach()

# 计算LN前的数据均值和方差
mean_before = x_linear.mean(dim=0)
var_before = x_linear.var(dim=0)

# 应用LN
x_ln = model(x)
x_ln = x_ln.detach()

# 计算LN后的数据均值和方差
mean_after = x_ln.mean(dim=0)
var_after = x_ln.var(dim=0)

# 随机选择一个样本
sample_index = 0
single_sample_before = x_linear[sample_index].unsqueeze(0)
single_sample_after = x_ln[sample_index].unsqueeze(0)

# 计算单个样本的均值和方差
mean_single_before = single_sample_before.mean()
var_single_before = single_sample_before.var()
mean_single_after = single_sample_after.mean()
var_single_after = single_sample_after.var()

# 绘制LN前后数据的分布
fig, ax = plt.subplots(2, 3, figsize=(18, 12))

# 绘制LN前的数据分布
ax[0, 0].hist(x_linear.detach().numpy().flatten(), bins=30, color='blue', alpha=0.7)
ax[0, 0].set_title('Before LN: Data Distribution')

# 绘制LN后的数据分布
ax[0, 1].hist(x_ln.detach().numpy().flatten(), bins=30, color='green', alpha=0.7)
ax[0, 1].set_title('After LN: Data Distribution')

# 绘制单个样本LN前的数据分布
ax[0, 2].hist(single_sample_before.detach().numpy().flatten(), bins=30, color='red', alpha=0.7)
ax[0, 2].set_title('Single Sample Before LN')

# 绘制LN前的数据均值和方差
ax[1, 0].bar(range(50), var_before, color='blue', alpha=0.7)
ax[1, 0].set_title('Before LN: Variance per Feature')
ax[1, 0].set_xticks(range(0, 50, 5))

# 绘制LN后的数据均值和方差
ax[1, 1].bar(range(50), var_after, color='green', alpha=0.7)
ax[1, 1].set_title('After LN: Variance per Feature')
ax[1, 1].set_xticks(range(0, 50, 5))

# 绘制单个样本LN后的均值和方差
ax[1, 2].bar(range(1), var_single_after.item(), color='red', alpha=0.7)
ax[1, 2].set_title('Single Sample After LN: Variance')
ax[1, 2].set_xticks([])

plt.tight_layout()
plt.show()

# 打印LN前后的数据均值和方差
print(f"Mean before LN: {mean_before}")
print(f"Mean after LN: {mean_after}")
print(f"Variance before LN: {var_before}")
print(f"Variance after LN: {var_after}")
print(f"Mean of single sample before LN: {mean_single_before}")
print(f"Variance of single sample before LN: {var_single_before}")
print(f"Mean of single sample after LN: {mean_single_after}")
print(f"Variance of single sample after LN: {var_single_after}")
可见右下角子图,LN之后,单条样本内部已经拉成正态分布了。

四、总结
BN和LN都是缓解深度学习模型梯度消失或者梯度爆炸重要技巧,实际建模过程中我们也可以通过对比加入BN或者LN前后的模型表现来调整最终的模型架构。但值得注意的是,在选择BN或者LN的时候,我们需要想清楚到底单一维度的正态分布对当前任务来说更有意义还是说单一样本内部数值的正态分布更有意义。
