EECS498 Deep Learning for Computer Vision (一)软件使用指南
#最近开始学习深度学习的相关基础知识,记录一下相关笔记及学习成果#
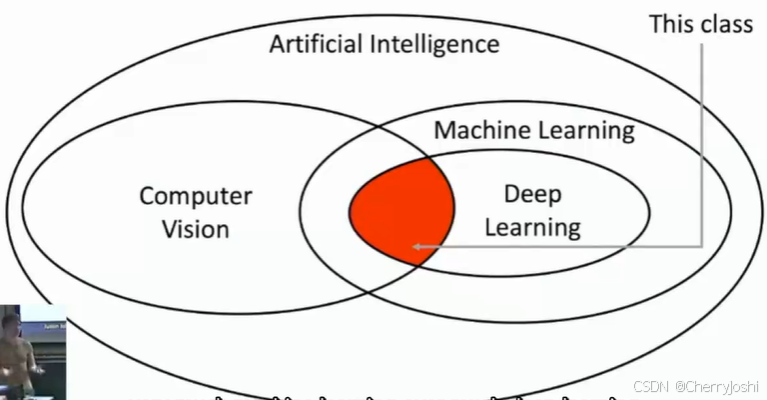
learning:building artificial systems that learn from data and experience
deep learning(a set of machine learning): hierarchical learning algorithms with many "layers", loosely inspired by the brain

人脸识别:viola Jones算法
IMAGENET图像学重要的数据集
lab 1(对于所使用的工具的基础知识):
https://cs231n.github.io/python-numpy-tutorial/
1.Jupyter and Colab Notebooks
Jupyter:本地运行python
Colab:运行在cloud,适合机器学习,数据分析;免费,无需启动,提前安装好了很多包,免费访问GPU和TPU
用colab打开指导(colab-tutorial.ipynb - Colab (google.com)):可以直接在云端运行指南里的代码(需要Google账号登录运行)
2.Python 的基本使用
python --version:查看python的版本
可用python进行快排算法的快速实现:
def quicksort(arr):
    if len(arr) <= 1:
        return arr
    pivot = arr[len(arr) // 2]
    left = [x for x in arr if x < pivot]
    middle = [x for x in arr if x == pivot]
    right = [x for x in arr if x > pivot]
    return quicksort(left) + middle + quicksort(right)
Note that unlike many languages, Python does not have unary increment (x++) or decrement (x--) operators.
布尔值(True,False)的运算不用&&,||,用英文单词:and, or,not,!=
字符串运算:
len():显示字符串的长度
hw12 = '{} {} {}'.format(hello, world, 12)  # string formatting
print(hw12)
s = "hello"
print(s.capitalize()) # Capitalize a string 首字母大写
print(s.upper()) # Convert a string to uppercase; prints "HELLO" 字母变成大写
print(s.rjust(7)) # Right-justify a string, padding with spaces 缩进
print(s.center(7)) # Center a string, padding with spaces 居中缩进
print(s.replace('l', '(ell)')) # Replace all instances of one substring with another 替换
print(' world '.strip()) # Strip leading and trailing whitespace删除字符串中的前后空白容器的使用:lists,dictionaries,sets,tuples
Lists(相当于数组,但尺寸是不固定的且可以包含不同的数据类型)
初始化:xs=[data]
添加元素:xs.append()
删除最后一个元素:xs.pop()
取子集:
nums = list(range(5))    # range is a built-in function that creates a list of integers 初始化nums=[0,1,2,3,4]
print(nums[2:4])    # Get a slice from index 2 to 4 (exclusive); prints "[2, 3]" 取出索引为2-4的
print(nums[2:])     # Get a slice from index 2 to the end; prints "[2, 3, 4]" 取出索引2以后的(包括2)
print(nums[:2])     # Get a slice from the start to index 2 (exclusive); prints "[0, 1]"取出索引2以前的(不包括2)
print(nums[:])      # Get a slice of the whole list; prints ["0, 1, 2, 3, 4]"
print(nums[:-1])    # Slice indices can be negative; prints ["0, 1, 2, 3]"
nums[2:4] = [8, 9] # Assign a new sublist to a slice
print(nums)         # Prints "[0, 1, 8, 9, 4]"
If you want access to the index of each element within the body of a loop, use the built-in enumerate function:
animals = ['cat', 'dog', 'monkey']
for idx, animal in enumerate(animals):
    print('#{}: {}'.format(idx + 1, animal))
List comprehensions can also contain conditions简化版
nums = [0, 1, 2, 3, 4]
even_squares = [x ** 2 for x in nums if x % 2 == 0]
print(even_squares)
Dictionaries(key,value)和Java中的map类似
初始化:用“:”连接 eg:d={'cat':'cute'}
获取value值:d.get(key)
获取所有数值(循环)d.items():
d = {'person': 2, 'cat': 4, 'spider': 8}
for animal, legs in d.items():
    print('A {} has {} legs'.format(animal, legs))
sets(无重复元素,无序)
初始化:animals={}
添加元素:add()
移除元素:remove()
tuple(有序数对,可以作为dictionary中的keys,也可以作为sets里的元素)
初始化:t=(data)
函数(Functions)
def定义: def+函数名+(参数): return。。。
Classes类
class +类名:
def _init_()(Constructor):
def ....
Numpy用于计算
import numpy as np
np.array([1,2,3])
np.zeros((2,2))创建一个2*2的零矩阵
np.ones((1,2))创建一个1*2的全1矩阵
np.full((2,2),data)创建一个2*2的值全为data的矩阵
分割:a[:2,1:3]前两行的索引为1-3之间的数
若b=a[:2,1:3] 更改b里的数值,a的数值也会同步改动
a = np.array([[1,2,3], [4,5,6], [7,8,9], [10, 11, 12]])
b = np.array([0, 2, 0, 1])
a[np.arange(4), b] += 10 #对应索引的数值加10
print(a)
Datatypes
dtype=np.int64指定为特定的数据类型
np.add(x,y)相加 np.subtract(x,y)相减 np.multiply(x,y)相乘【对应元素相乘】 np.divide(x,y)相除
np.dot(x,y)/@:矩阵乘法 np.sum:矩阵中元素之和
x.T:矩阵转置
Matplotlib画图工具
import matplotlib.pyplot as plt
plt.plot(x,y):画图,x轴数据与y轴数据
# Compute the x and y coordinates for points on a sine curve
x = np.arange(0, 3 * np.pi, 0.1)
y = np.sin(x)

# Plot the points using matplotlib
plt.plot(x, y)
也可以同时画多条线:
plt.plot(x,y1)
plt.plot(x,y2)
更多请查找文档:https://matplotlib.org/2.0.2/api/pyplot_api.html
