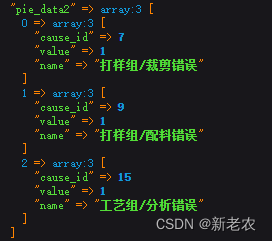
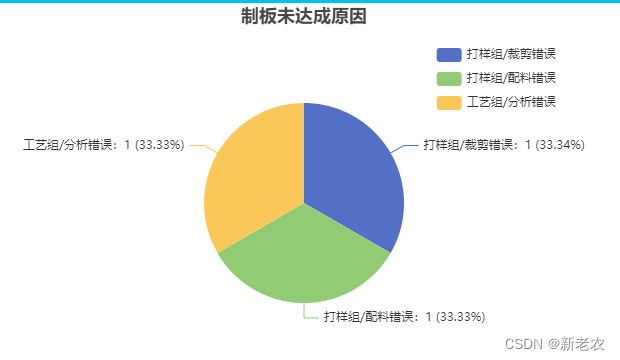
vue echarts 画饼图

页面:
    {{--饼图--}}
    <template>
      <div class="col-sm-6">
        <div id="mychart" :style="{width: '100%', height: '400px'}">
        </div>
      </div>
    </template>

  pie_data: [],  //饼图
  myChart: {},
  pieName: [],


/*
 * 再画个饼给秃吃
 **/
  drawPieChart(){
      var that = this;
      var pie_title =  "制板未达成原因";
      let select_type = that.selectType;
      if (select_type == 2){
        pie_title =  "样品未达成原因";
      }
      for (let i = 0; i < that.pie_data.length; i++) {
        that.pieName[i] = that.pie_data[i].name;
      }
      var option;
      option = {
        // xAxis: {
        // },
        // yAxis: {
        // },
        legend: {
          // 图例
          data: that.pieName2,
          right: "10%",
          top: "10%",
          orient: "vertical"
        },
        title: {
          // 设置饼图标题,位置设为顶部居中
          text: pie_title,
          top: "0%",
          left: "center"
        },

        series: [
          {
            type: "pie",
            data: that.pie_data,
            label: {
              show: true,
              formatter: "{b}:{c} ({d}%)" // b代表名称,c代表对应值,d代表百分比
            },
            radius: "50%", //饼图半径

          }
        ]

      };

      var chartDom = document.getElementById('mychart2');
      var myChart = echarts.init(chartDom);
      option && myChart.setOption(option);
      //随着屏幕大小调节图表
      // window.addEventListener("resize", () => {
      //   that.myChart.resize();
      // });
    },
