【canvas】简易小实例(钟表和画布)
看了大佬的canvas 2d视频视频链接 通过两个小实例介绍了canvas的各项函数与功能这里放出代码供参考
文章目录
- 画布实例
- 钟表实例
- 总结
画布实例
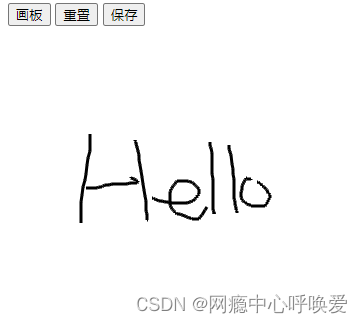
实现了鼠标可以在画板上绘制图像,且可以重置和保存为png。原理是监听鼠标的操作事件,通过不断的设定canvas的绘制起点位置从而实现连续的鼠标绘制
实现效果如下:

<!DOCTYPE html>
<html lang="en">

<head>
    <meta charset="UTF-8">
    <meta http-equiv="X-UA-Compatible" content="IE=edge">
    <meta name="viewport" content="width=device-width, initial-scale=1.0">
    <title>Document</title>
    <style>
        #canvas {
            /* background: brown; */
        }
    </style>
</head>

<body>
    <div class="menu">
        <button class="button"> 画板</button>
        <button id="clear">重置</button>
        <button id="save"> 保存</button>
    </div>
    <div class="window">
        <div class="top">
            <div class="button"> </div>
            <div class="button"> </div>
            <div class="button"> </div>
        </div>
        <canvas id="canvas" width="500" height="500"></canvas>
    </div>

    <script>
        let painting = false;
        let startPoint = { x: undefined, y: undefined };
        /** @type {HTMLCanvasElement} */
        const canvas = document.getElementById("canvas");
        const clear = document.getElementById("clear");
        const save = document.getElementById("save");
        const ctx = canvas.getContext("2d");

        canvas.onmousedown = e => {
            let x = e.offsetX;
            let y = e.offsetY;
            startPoint = { x: x, y: y };
            painting = true;
        };

        // 不断的将老位置与新位置相连
        canvas.onmousemove = e => {
            let x = e.offsetX;
            let y = e.offsetY;
            newPoint = { x: x, y: y };
            if (painting) {
                drawLine(startPoint.x, startPoint.y, newPoint.x, newPoint.y);
                startPoint = newPoint; // 起始点重新设置
            }
        };

        canvas.onmouseup = () => {
            painting = false;
        };

        function drawLine(xStart, yStart, xEnd, yEnd) {
            ctx.beginPath();
            ctx.lineWidth = 3;
            ctx.moveTo(xStart, yStart);
            ctx.lineTo(xEnd, yEnd);
            ctx.stroke();
            ctx.closePath();
        }

        clear.onclick = () => {
            ctx.fillStyle = "#FFFFFF";
            ctx.clearRect(0, 0, canvas.width, canvas.height);
        };

        save.onclick = () => {
            const url = canvas.toDataURL("image/jpg");
            const a = document.createElement("a");
            a.href = url;
            a.download = "画板";
            a.target = "_blank";
            a.click();
        };
        // 填充颜色
        // ctx.fillStyle = "orange";
        // ctx.fillStyle = "#FFA500";
        // ctx.fillStyle = "#rgb(255,165,0)";
        // ctx.fillStyle = "#rgb(255,165,0, 0.5)";

        // 添加图片
        // var img = new Image();
        // img.src = "logo.png";
        // 当图片加载完之后运行:
        // img.onload = function () {
        //     ctx.drawImage(img, 0, 0); // 有9个参数
        // }

        // 新建文本
        // ctx.fillText("sdasdsa", 100, 100, 200);
        // ctx.strokeText("8888888", 20, 200, 500);


        // 绘制圆形
        // ctx.arc(x,y,r,startAngle, endAngle, anticClockwise);
        // ctx.arc(100, 100, 50, 0, 2 * Math.PI);
        // ctx.stroke();
        // 贝塞尔曲线
        // ctx.quadraticCurveTo(cp1x,cp2y,x,y);
        // ctx.bezierCurveTo(cp1x, cp1y, cp2x, cp2y, x, y); // cp12两个控制点坐标, x与y是曲线结束点坐标

        // 绘制矩形
        // ctx.rect(0, 0, 100, 200);
        // ctx.stroke();
        // ctx.strokeRect(0, 0, 100, 300);

        // ctx.fillRect(0, 0, 100, 200);
        // ctx.clearRect(50, 50, 10, 100);

        // 绘制直线
        // ctx.beginPath();
        // ctx.moveTo(100, 100);
        // ctx.lineTo(200, 200);
        // ctx.lineTo(300, 200);
        // // ctx.lineTo(100, 100);
        // ctx.closePath();
        // ctx.stroke();
        // // ctx.fill(); 填满
    </script>
</body>

</html>
钟表实例
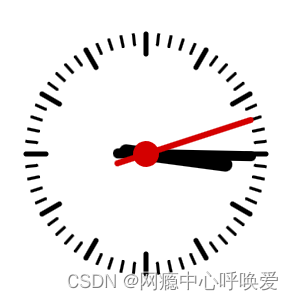
原理是通过requestAnimationFrame功能每秒循环渲染一次画布,再通过 new Date();不停获取当前时间,变换指针的角度位置
        // 定义一个回调函数
        function animate(time){
            // 更新动画状态
            update(time);
            // 绘制动画帧
            draw();
            // 请求下一次动画帧
            window.requestAnimationFrame(animate);
        }
        // 开始动画循环
        window.requestAnimationFrame(animate);
实现效果如下:

<!DOCTYPE html>
<html lang="en">

<head>
    <meta charset="UTF-8">
    <meta http-equiv="X-UA-Compatible" content="IE=edge">
    <meta name="viewport" content="width=device-width, initial-scale=1.0">
    <title>Document</title>
</head>

<body>
    <canvas id="canvas" width="600" height="600"></canvas>
    <script>

        /** @type {HTMLCanvasElement} */
        const canvas = document.getElementById("canvas");
        const ctx = canvas.getContext("2d");

        // 定义一个回调函数
        function animate(time) {
            const now = new Date();
            const sec = now.getSeconds();
            const min = now.getHours();
            let hr = now.getHours();
            // 需要给小时换算成12小时制
            hr = hr >= 12 ? hr - 12 : hr;
            ctx.save();
            ctx.clearRect(0, 0, canvas.width, canvas.height);

            ctx.translate(canvas.width / 2, canvas.height / 2);// 将坐标轴原点移到画布中心
            ctx.rotate(-Math.PI / 2);// 将坐标轴旋转90度,变为我们现实中常用的坐标系

            ctx.strokeStyle = "black";
            ctx.lineWidth = 5;
            ctx.lineCap = "round";

            // 绘制时针
            ctx.save();
            for (let i = 0; i < 12; i++) {
                ctx.beginPath();
                ctx.rotate(Math.PI / 6);
                ctx.moveTo(100, 0);
                ctx.lineTo(120, 0);
                ctx.stroke();
            }
            ctx.restore();

            // 绘制分针
            ctx.save();
            ctx.lineWidth = 3;
            for (let i = 0; i < 60; i++) {
                ctx.beginPath();
                ctx.rotate(Math.PI / 30);
                ctx.moveTo(110, 0);
                ctx.lineTo(120, 0);
                ctx.stroke();
            }
            ctx.restore();

            // 绘制小时指针
            ctx.save();
            // 时针的角度多走0.5度, 多一秒时针多走0.083度
            ctx.rotate(
                hr * (Math.PI / 6) + (Math.PI / 360) * min + (Math.PI / 21600) * sec
            );
            ctx.lineWidth = 14;
            ctx.beginPath();
            ctx.moveTo(-20, 0);
            ctx.lineTo(80, 0);
            ctx.stroke();
            ctx.restore();

            // 绘制分钟指针
            ctx.save();
            ctx.rotate(
                (Math.PI / 30) * min + (Math.PI / 1800) * sec
            );
            ctx.lineWidth = 10;
            ctx.beginPath();
            ctx.moveTo(-28, 0);
            ctx.lineTo(105, 0);
            ctx.stroke();
            ctx.restore();

            // 绘制秒数指针
            ctx.save();
            ctx.rotate((sec * Math.PI) / 30);
            ctx.strokeStyle = "#D40000";
            ctx.fillStyle = "#D40000";
            ctx.lineWidth = 6;
            ctx.beginPath();
            ctx.moveTo(-30, 0);
            ctx.lineTo(110, 0);
            ctx.stroke();

            // 绘制秒针中间的那个圆点
            ctx.beginPath();
            ctx.arc(0, 0, 10, 0, Math.PI * 2, true);
            ctx.fill();
            ctx.fillStyle = "rgba(0,0,0,0)";
            ctx.arc(0, 0, 3, 0, Math.PI * 2, true);
            ctx.fill();
            ctx.stroke();
            ctx.restore();

            ctx.restore();
            // 请求下一次动画帧
            window.requestAnimationFrame(animate);
        }
        // 开始动画循环
        window.requestAnimationFrame(animate);


        // // 定义一个回调函数
        // function animate(time){
        //     // 更新动画状态
        //     update(time);
        //     // 绘制动画帧
        //     draw();
        //     // 请求下一次动画帧
        //     window.requestAnimationFrame(animate);
        // }
        // // 开始动画循环
        // window.requestAnimationFrame(animate);

    </script>
</body>

</html>
总结
- 感觉canvas和python的小乌龟绘图差不多,但是能够实现的多了很多,尤其是动画方面
- 自己还需要提升阅读英文原文档的能力
